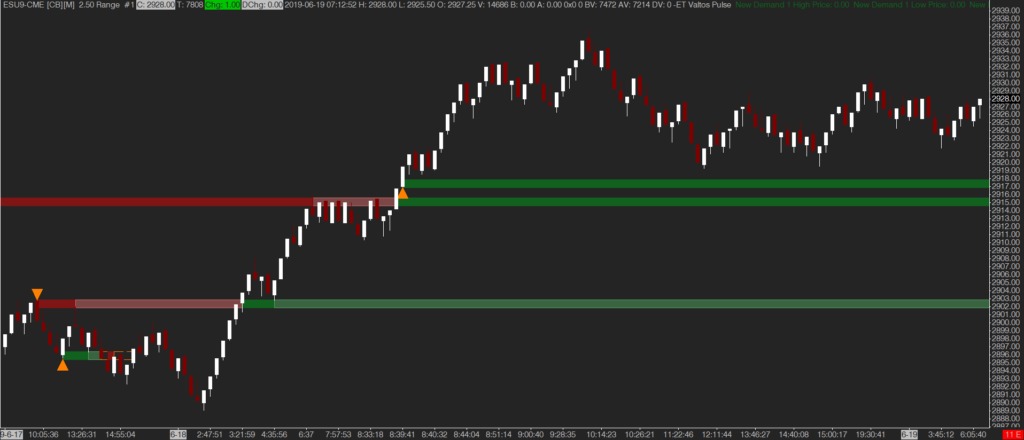
Valtos Orderflows Pulse analyses:
- Order Flow
What is currently trading at the moment and how it is trading? - Delta
The net difference between aggressive buyers and aggressive sellers. - Point of Control
The price level in the bar with the most volume. The Pulse uses the Points of Controls that are significant. - Imbalances
Price levels where aggressive traders outnumber other traders by big percentages. - Volume
There needs to be enough volume in the order flow to get an accurate assessment of the situation. - Price Action
The reaction of price rto the order flow helps determine what should happen. - Swing Analysis
Referencing recent swing highs and swing lows
emoji trading’s implementation of the indicator algorithm is enhanced with the emoji Advanced Lookback Filter and EmojiZone Visualisation Modes.
You can read more about the Valtos Pulse indicator at: https://www.orderflows.com/pulse.html
Indicator Settings & Outputs Reference
Filter Valtos Pulse Supply/Demand Events using the emoji Advanced Lookback Filter to only identify events that occur at relative highs and lows.
Select whether price and Delta must match, i.e. up bars have positive Delta and down bars have negative Delta.
If Delta Analysis is enabled, this is the threshold for opposing Delta. For example, setting this to 50 will allow an up bar with negative delta of no less than -50 or a down bar with positive delta of no more than +50 to be considered.
Select whether zero volume within the bar disables evaluation of the Pulse condition or not.
Long Bar Evaluation?
Select whether price levels closer to (Short Bar Evaluation) or further from (Long Bar Evaluation) the bar extreme are evaluated.
The minimum volume necessary at the first Pulse evaluation price level within the bar.
The strength factor between the price levels being evaluated by the Valtos Pulse algorithm.
Select whether the bar’s POC location should be considered within the Valtos Pulse algorithm.
The number of ticks away from the bar high/low that the Supply/Demand indicator Output Signals are drawn.
The standard set of EmojiZone Visualization Settings as described within the EmojiZone Visualisation Modes documentation.
This indicator provides:
• Output Signals
• EmojiZone Data