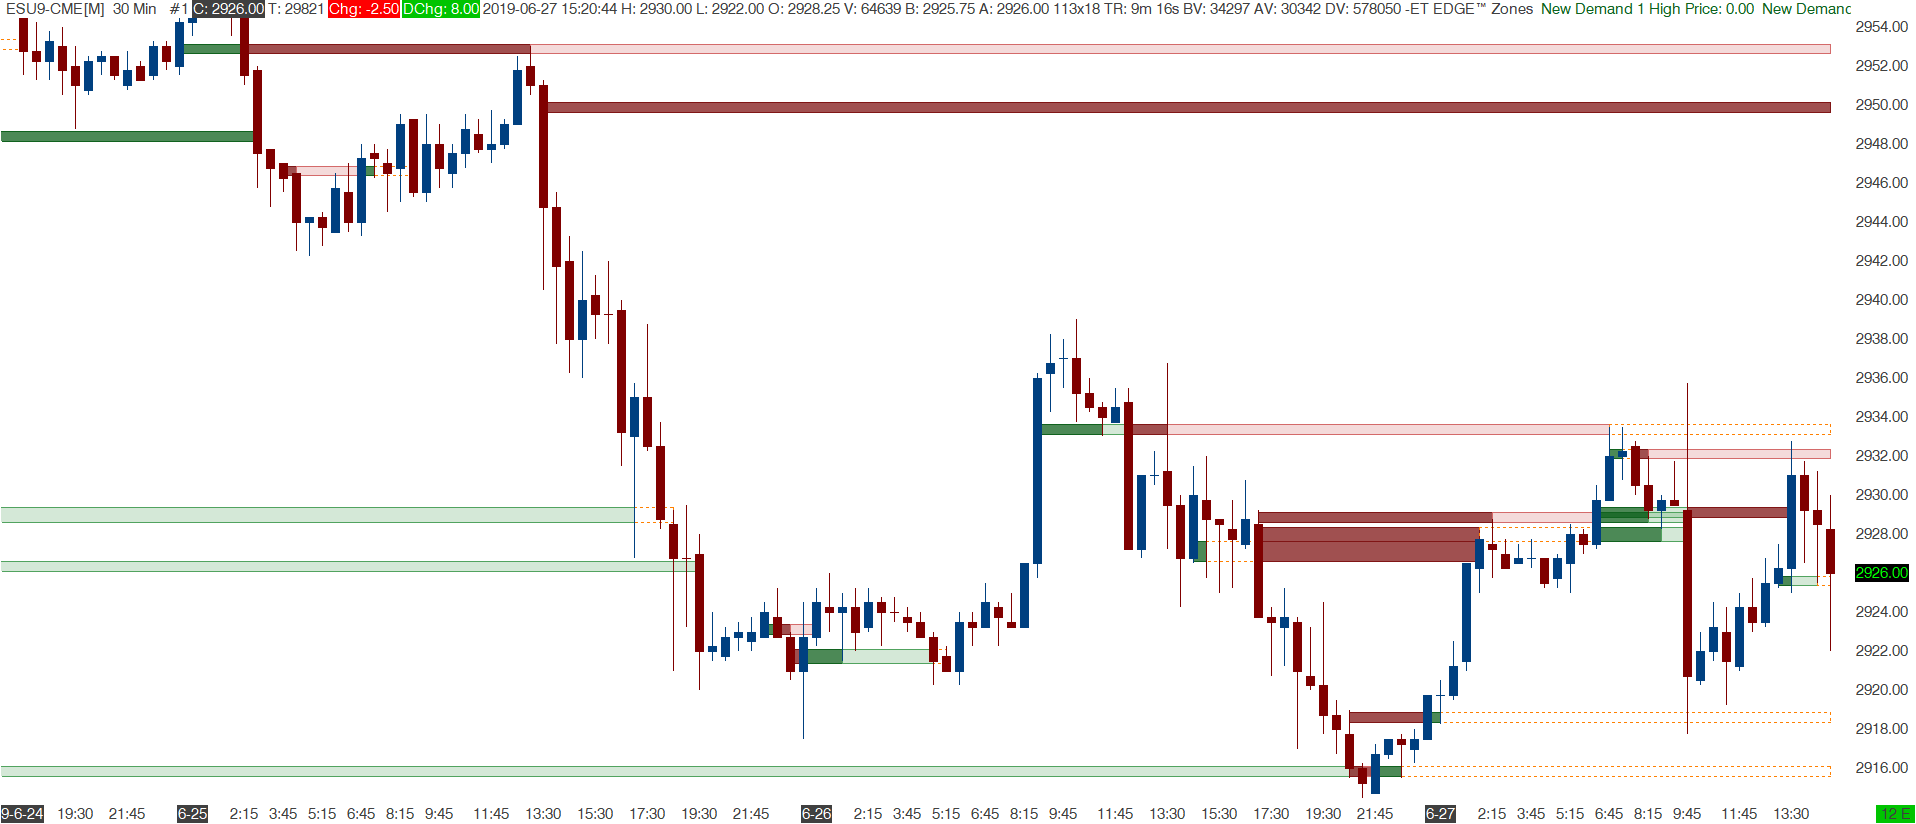
EDGE Zones™
Identify & Track Aggressive Supply & Demand
Read more… or explore the user guide
EDGE Zones™ is an add-in for selected trading platforms and available on a monthly subscription.
EDGE Zones™ is also available as part of the emoji trading Order Flow Suite of 14 indicators including a 14-day free trial.
Click here for combined trading platform and indicator bundles.
We take payment details at sign up but you will not be charged until you enter a paid subscription at the end of the trial period. You can cancel your free trial or current subscription at any time through our website.
Identify & Track Aggressive Supply & Demand
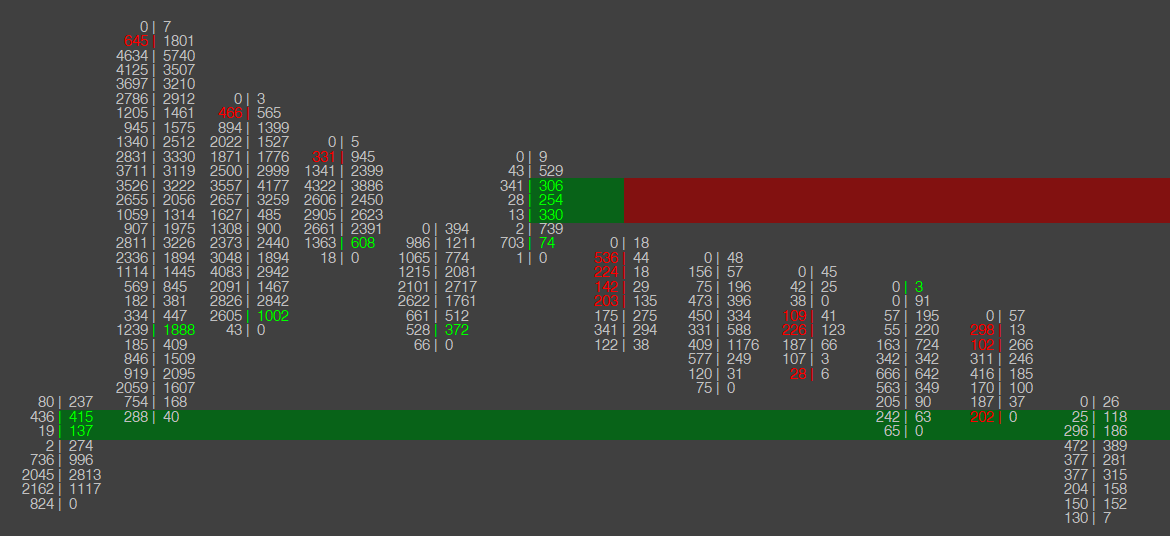
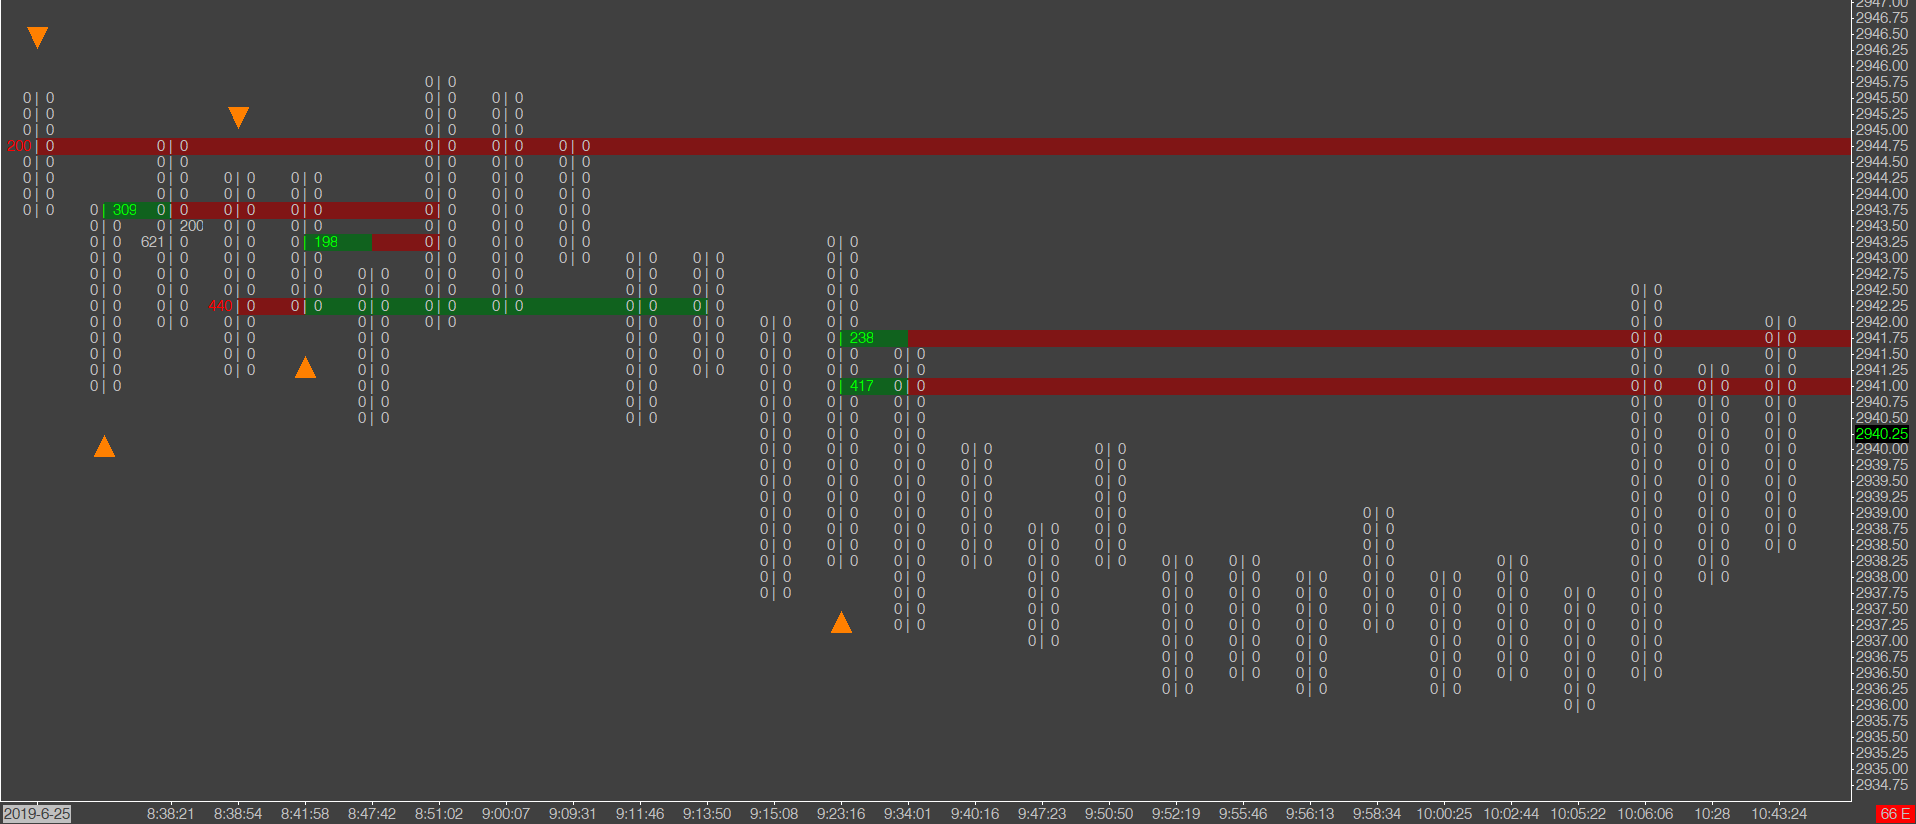
EDGE Zones™ identify when aggressive buyers or sellers enter the market by examining the volume traded at each price level. You can fine tune this order flow indicator based upon:
- the aggressiveness of buying or selling
- volume and volume delta minimum requirements
- the minimum number of price levels, or ‘stacked imbalances’, required to identify an EDGE Zone™
- there was at least 6x more buying than selling (or vice-versa) across 3 adjacent prices
- a ‘massive imbalance’ of more than 10,000 contracts were bought or sold
- there was 25x more buying than selling (or vice-versa) at a given price level
- the net difference between buying and selling was at least 450 contracts
Unique Advanced Features
Supported Trading Platforms
EDGE Zones™ is available for:
- NinjaTrader 8 – Free, Lease & Lifetime licenses are all supported on PCs running Windows 10
- Sierra Chart – fully compatible with Service Package 3 & Package 5
Market Delta User? Click here for details of our all-inclusive
Sierra Chart Package 5 & EDGE Zones™ bundle
Simply connect to your broker’s data feed. Supported brokerages and data feeds include: AMP, CQG, Rithmic, GAIN, Interactive Brokers…