EmojiZones may be visualized using modes selected from the EmojiZone Visualization setting. These are illustrated below.
Please refer to the Pullback Analysis section of this guide to understand how this mode is used with selected indicators.
The price levels are projected forward from the bar that triggered the Supply/Demand Event for the number of bars entered in the Fixed Projection Distance setting.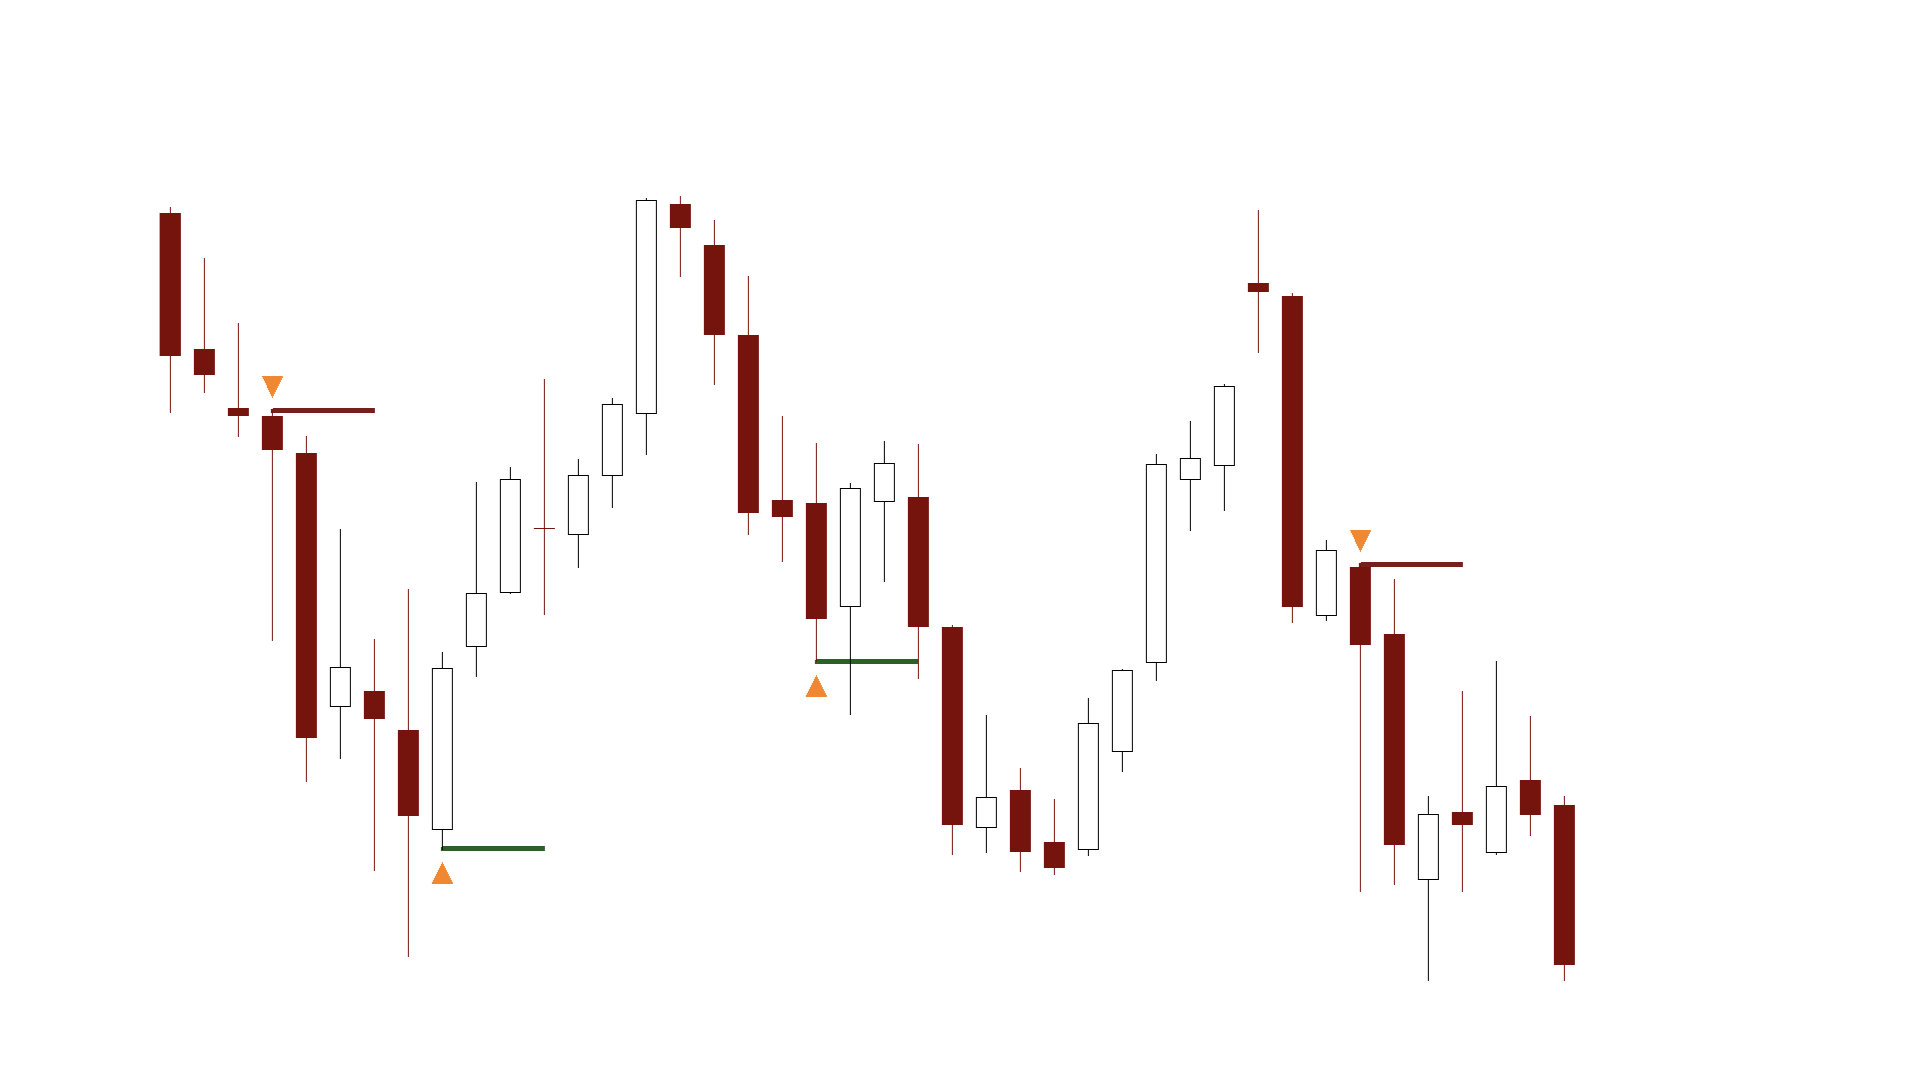
The highest and lowest price levels are projected forward until these price levels next trade. An optional label whose text is set in the Extend Until… Label setting can be displayed.
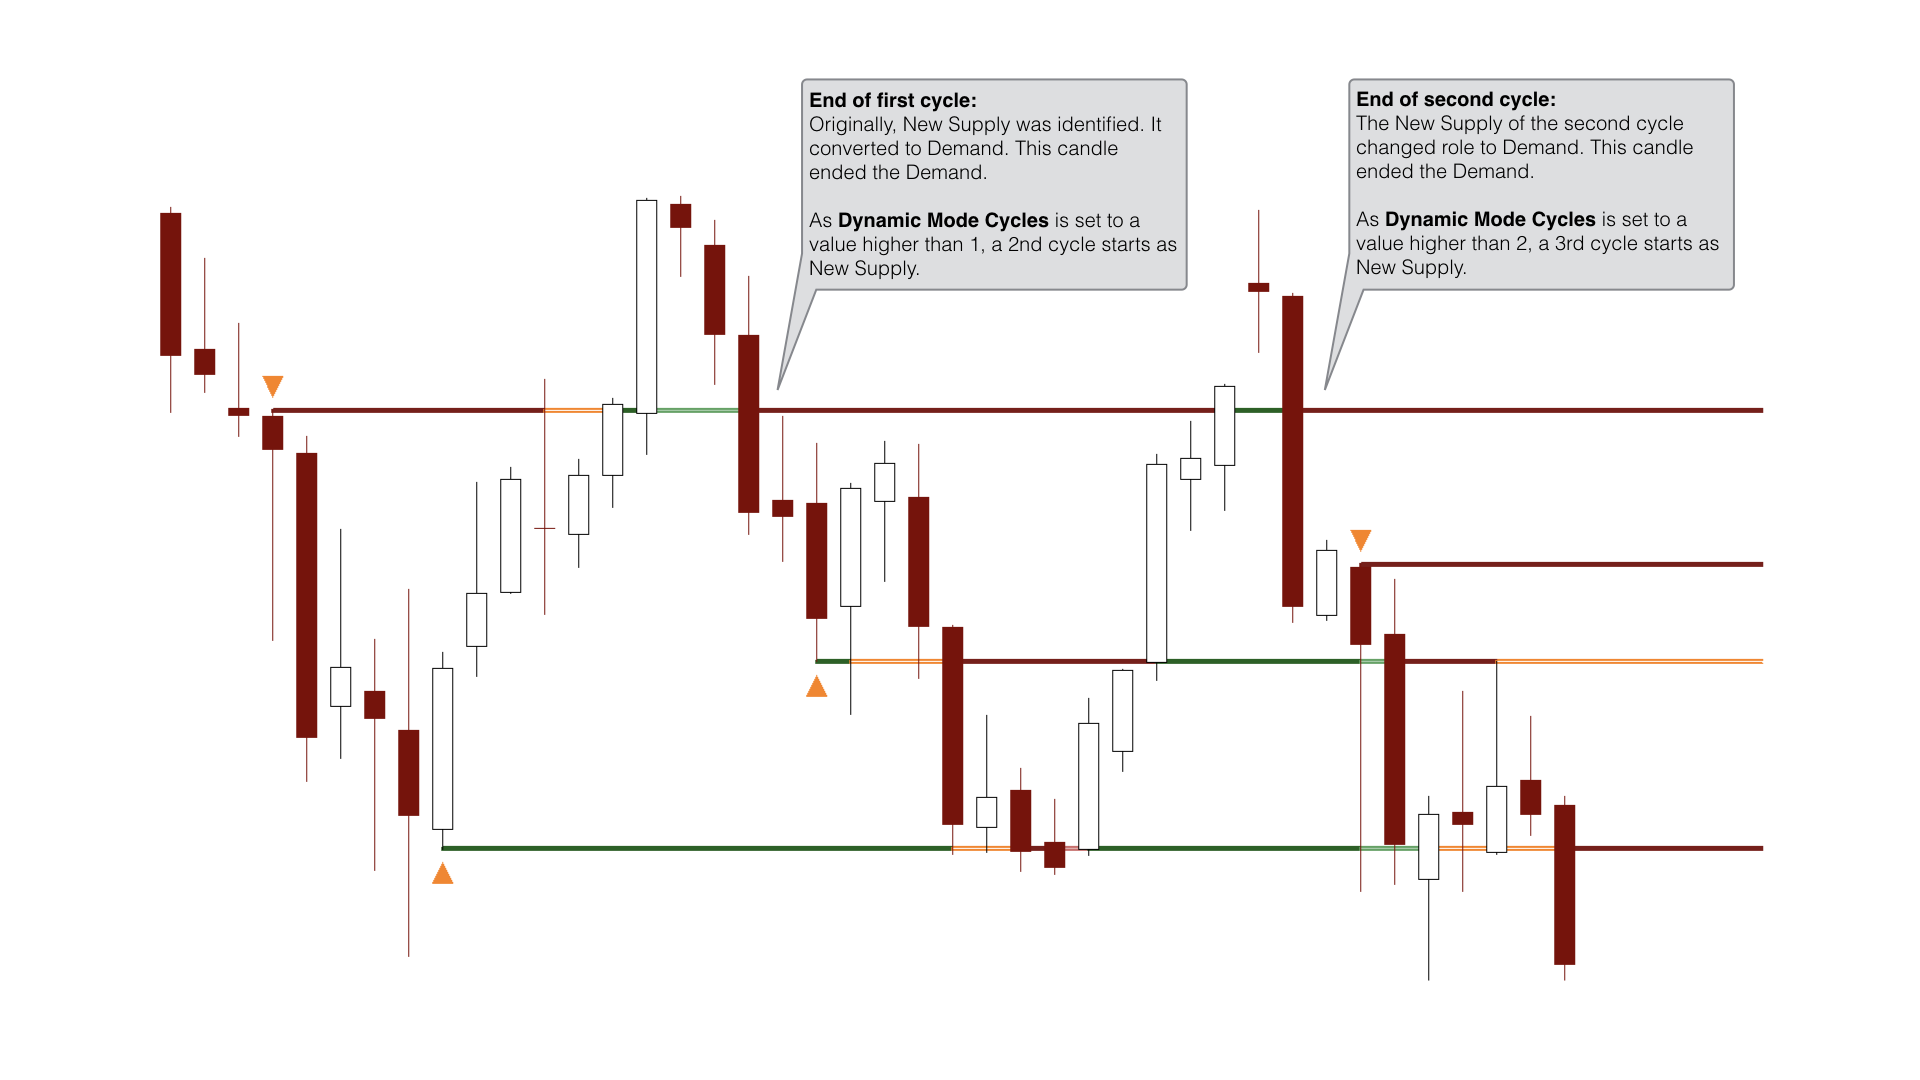
The price levels are projected forward and will display changed states as described within the Introduction to EmojiZone Visualization Modes.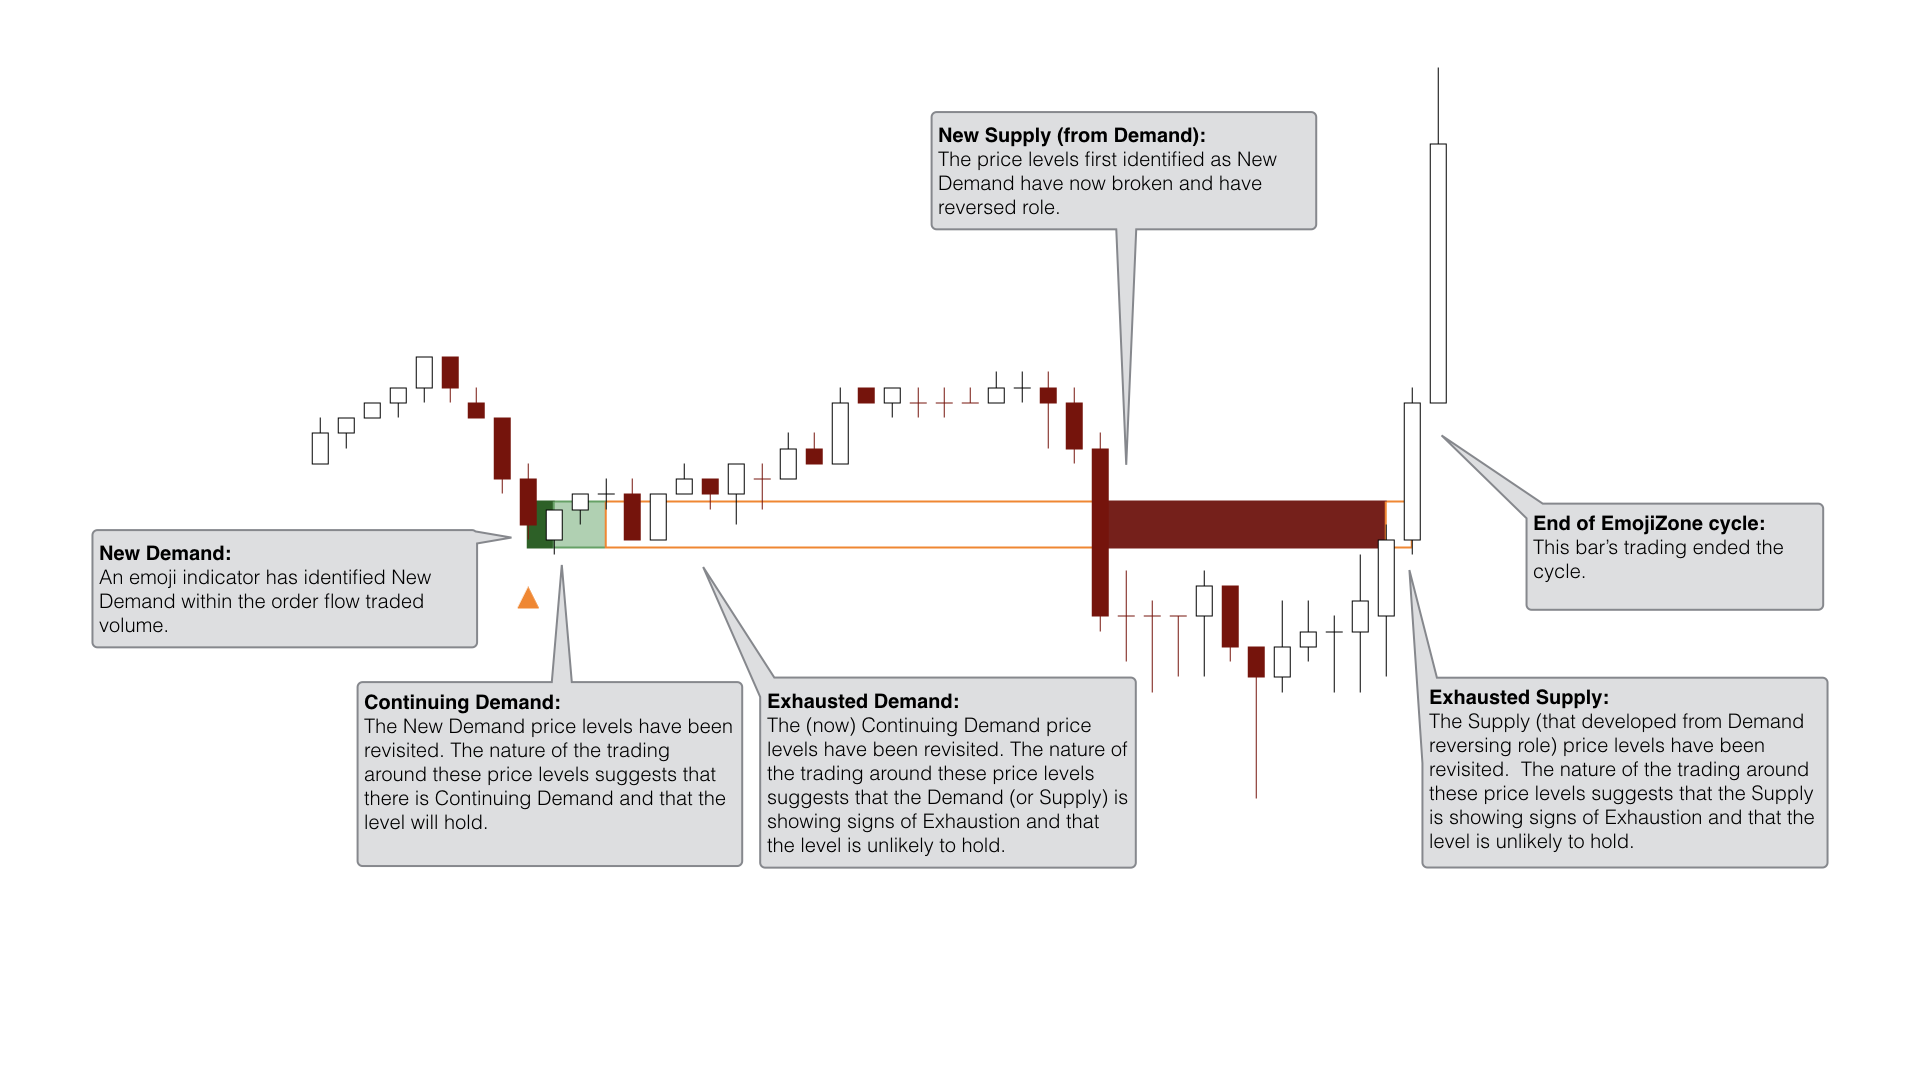
Use this setting to decide whether broken Demand (or Supply) changes role to Supply (or Demand).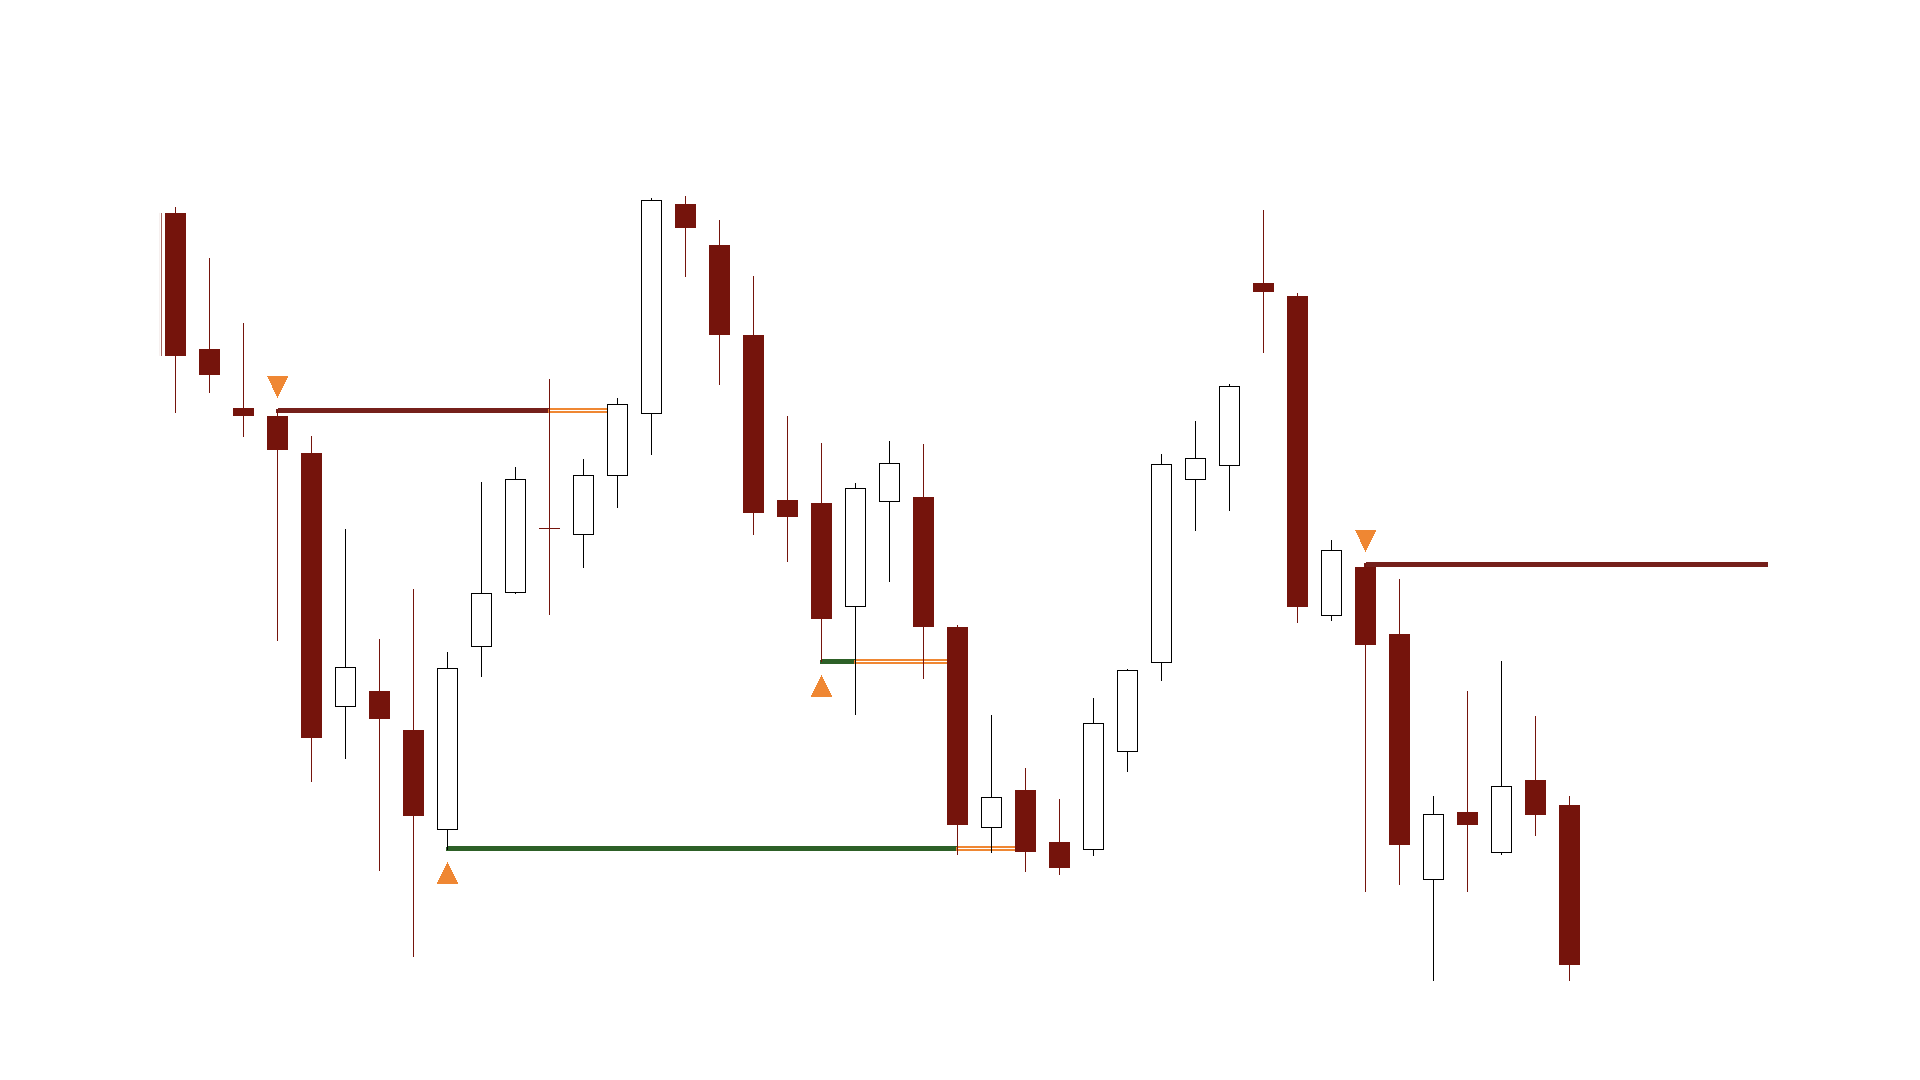
Use this setting to decide whether EmojiZone price levels are evaluated using Order Flow or Price Only.
In Order Flow mode, the Continuing Demand (Supply) and Exhausted Demand (Supply) states are available.
In Price Only mode, New Demand (Supply) becomes Supply (Demand) when price closes below (above) the price level. Continuing and Exhausted states are determined based upon order flow.
This produces a similar display to the Extend Until Future Intersection visualization mode however
– Extend Until Future Intersection will stop projection then price trades at the EmojiZone price level
– Dynamic mode will stop projection when price trades above a Supply price level or below a Demand price level
Enter the maximum number of EmojiZone cycles to evaluate and visualize.