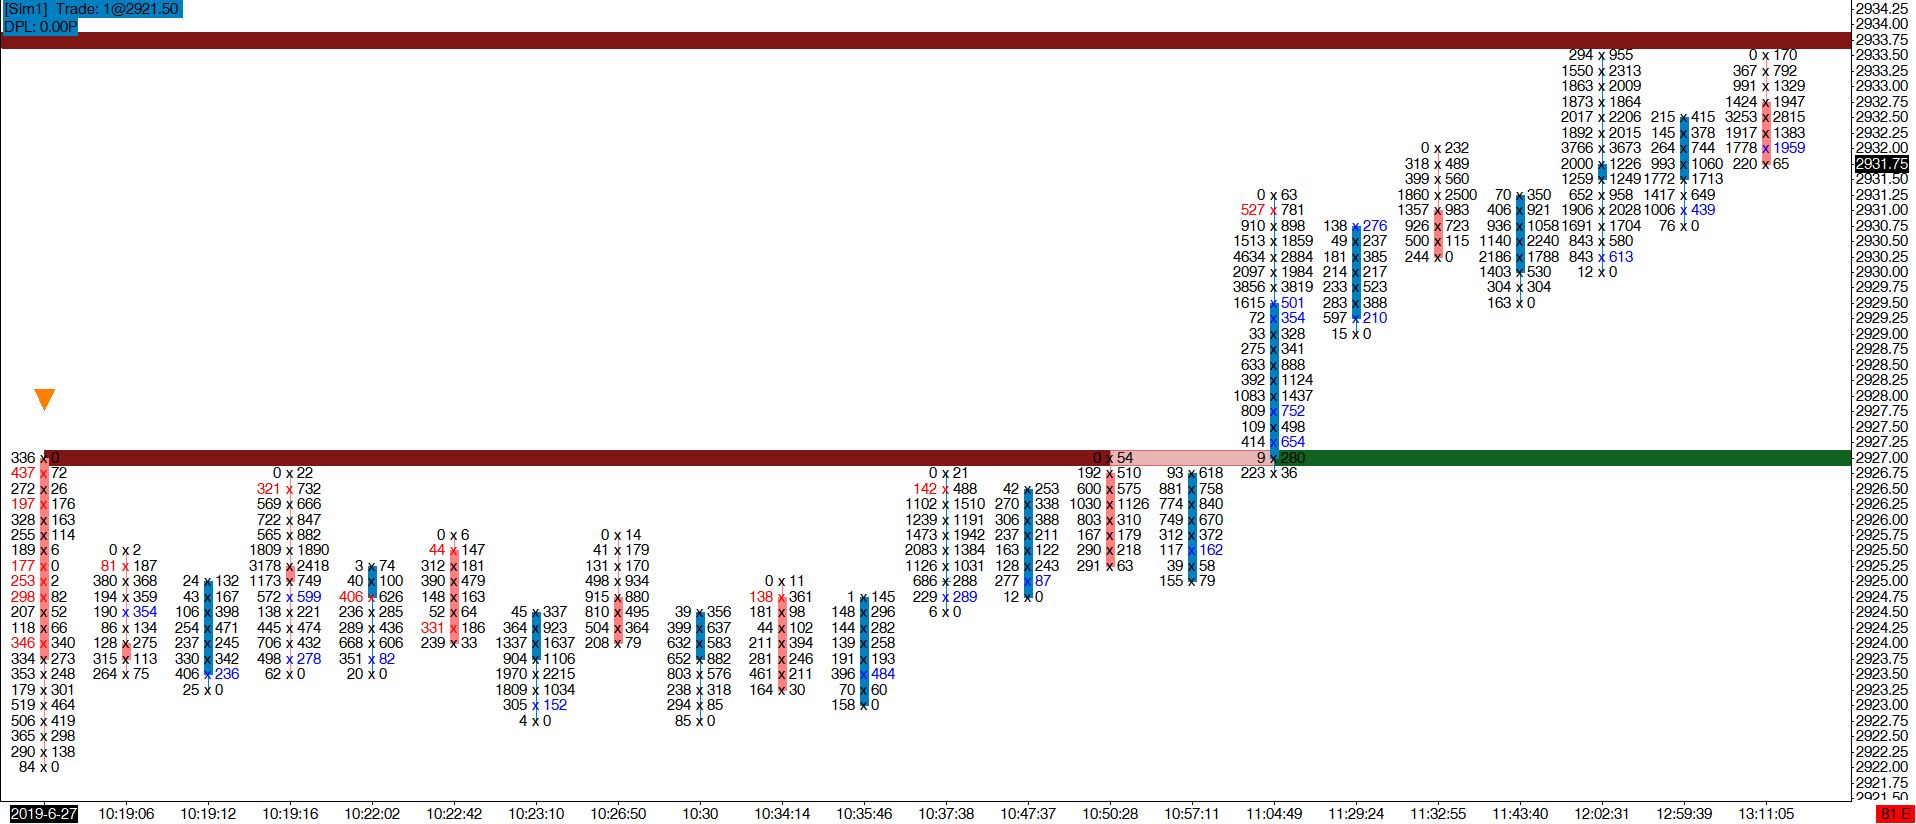
The Small Prints indicator identifies Aggression and Exhaustion conditions through a lack of volume.
- Aggression
Small Prints and Zero Prints within the body of a bar indicate where Aggressive volume caused the market to move at a rate that resulted in a lack of trade using market orders on the opposite side of the market. The Aggressive volume may or may not be highlighted with a bid/ask imbalance if these are being used within a Footprint® chart but the percentage comparison levels for diagonal bid/ask imbalances are arbitrary and the typical 3x to 6x volume may or may not be aggressive.
The point of identifying a lack of trade is that it is clear that there was sufficient volume trading on one side of the market to move price through an area quickly and prevent balanced levels of trade occurring on the other side of the market.
Small Prints can highlight volumes where nothing traded (Zero Prints), an absolute low level traded (Small Prints) or a relative low level traded (Thin Spots) that oppose a bid/ask imbalance.
In thicker markets, e.g. ES and CL, zero prints on longer term charts, e.g. 30 minute and daily can be relatively rare events and levels worth noting. They represent an unfilled gap. Small Prints enables visualization and tracking of such levels and in combination with the indicator’s EmojiZone Visualizations you can maintain visibility of significant levels that occurred days or even months ago that have potential to act as intra-day exit targets or reversal levels.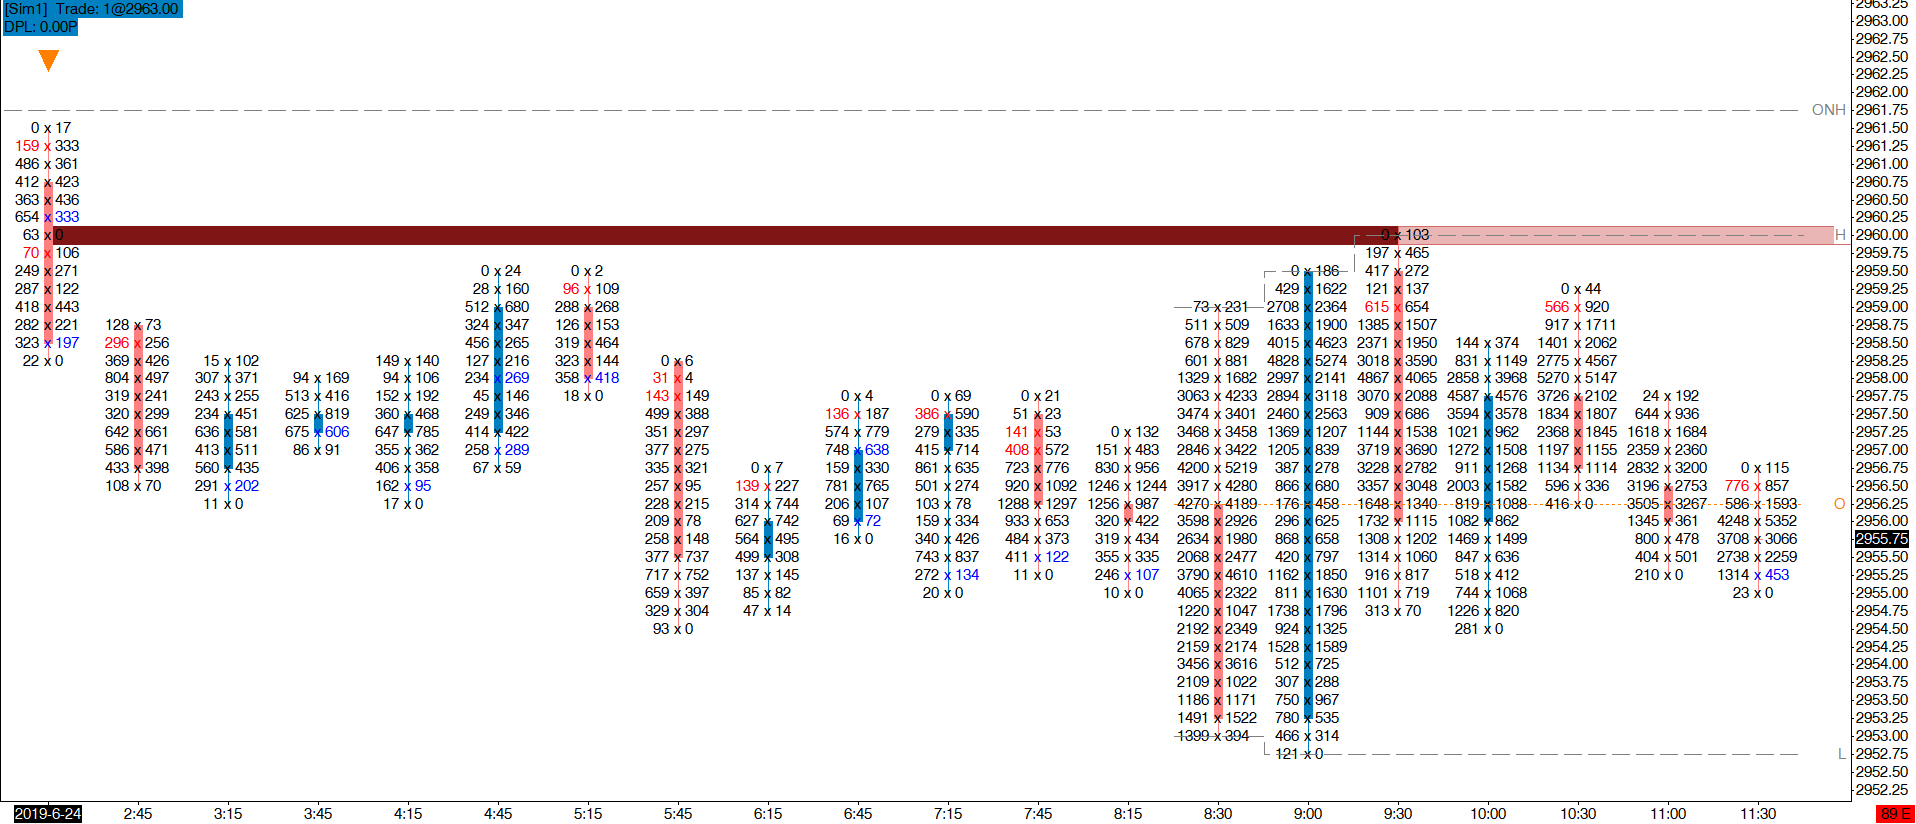
- Exhaustion
A low volume of buying at the top of a bar or a low volume of selling at the bottom of a bar can be a clear sign of market exhaustion, literally the last buyer or seller. Combined with the emoji Advanced Lookback Filter you can highlight and track levels where the last buyer bought or the last seller sold and make trading decisions armed with the knowledge of price levels that demonstrate a lack of demand at higher prices and supply at lower prices.
- Pullback Evaluation
This indicator can also identify a lack of volume in the pullback order flow. Please refer to the Pullback Analysis section for a detailed explanation of this mode.
Indicator Settings & Outputs Reference
Select whether EDGE Zones is to analyse the volume in the main chart bars or in a specified Volume Profile study.
Selected Volume Profile Study
Select the Volume Profile Study on the chart to which Volume Profile Analysis should apply.
Learn more about emoji Volume Profile Analysis.
The imbalance settings are used to control how relative volume Small Prints (Thin Spots – see Maximum Small Print Volume % below) are identified opposite a bid/ask imbalance. Read this section: Imbalance Settings for a full explanation of each setting:
• Minimum Diagonal Bid/Ask Imbalance %
• Compare Zero Diagonal Bid/Ask Imbalances?
• Miniumum Volume
• Minimum Bid/Ask Delta
The Small Print At Extreme condition can be filtered using the Price Reversal Filter.
Select any or all of the Absorption condition(s) that you wish Absorption Pro to detect and visualize:
• Identify Small Prints At Bar Extreme? (Yes/No)
• Identify Zero Prints In Bar Body? (Yes/No)
• Identify Small Prints In Bar Body? (Yes/No)
• Identify Stop Runs? (Yes/No) (Sierra Chart only)
Enter the maximum volume permitted for a Small Print At Bar Extreme or Small Print In Bar Body to be identified.
Enter the maximum percentage of the same side volume for a Small Print that opposes a bid/ask imbalance to be identified. For example:
• a buy imbalance exists
• the bid volume is 4 contracts
• the total bid volume is 100 contracts
A small print will be identified if this input is 4% or higher. If the input is 3%, the Small Print will fail the filtering as the volume represents 4% of the same side volume but our maximum threshold is 3%.
Select whether the indicator is to be used to analyse pullback order flow. Please refer to the Pullback Analysis section for a detailed explanation of this mode.
The number of ticks away from the bar high/low that the Supply/Demand indicator Output Signals are drawn.
The number of ticks away from the bar high/low that the Pullback indicator signals are drawn when using Pullback Analysis.
The standard set of EmojiZone Visualization Settings as described within the EmojiZone Visualisation Modes documentation.
This indicator provides:
• Output Signals
• EmojiZone Data
• Pullback Analysis Output Signals