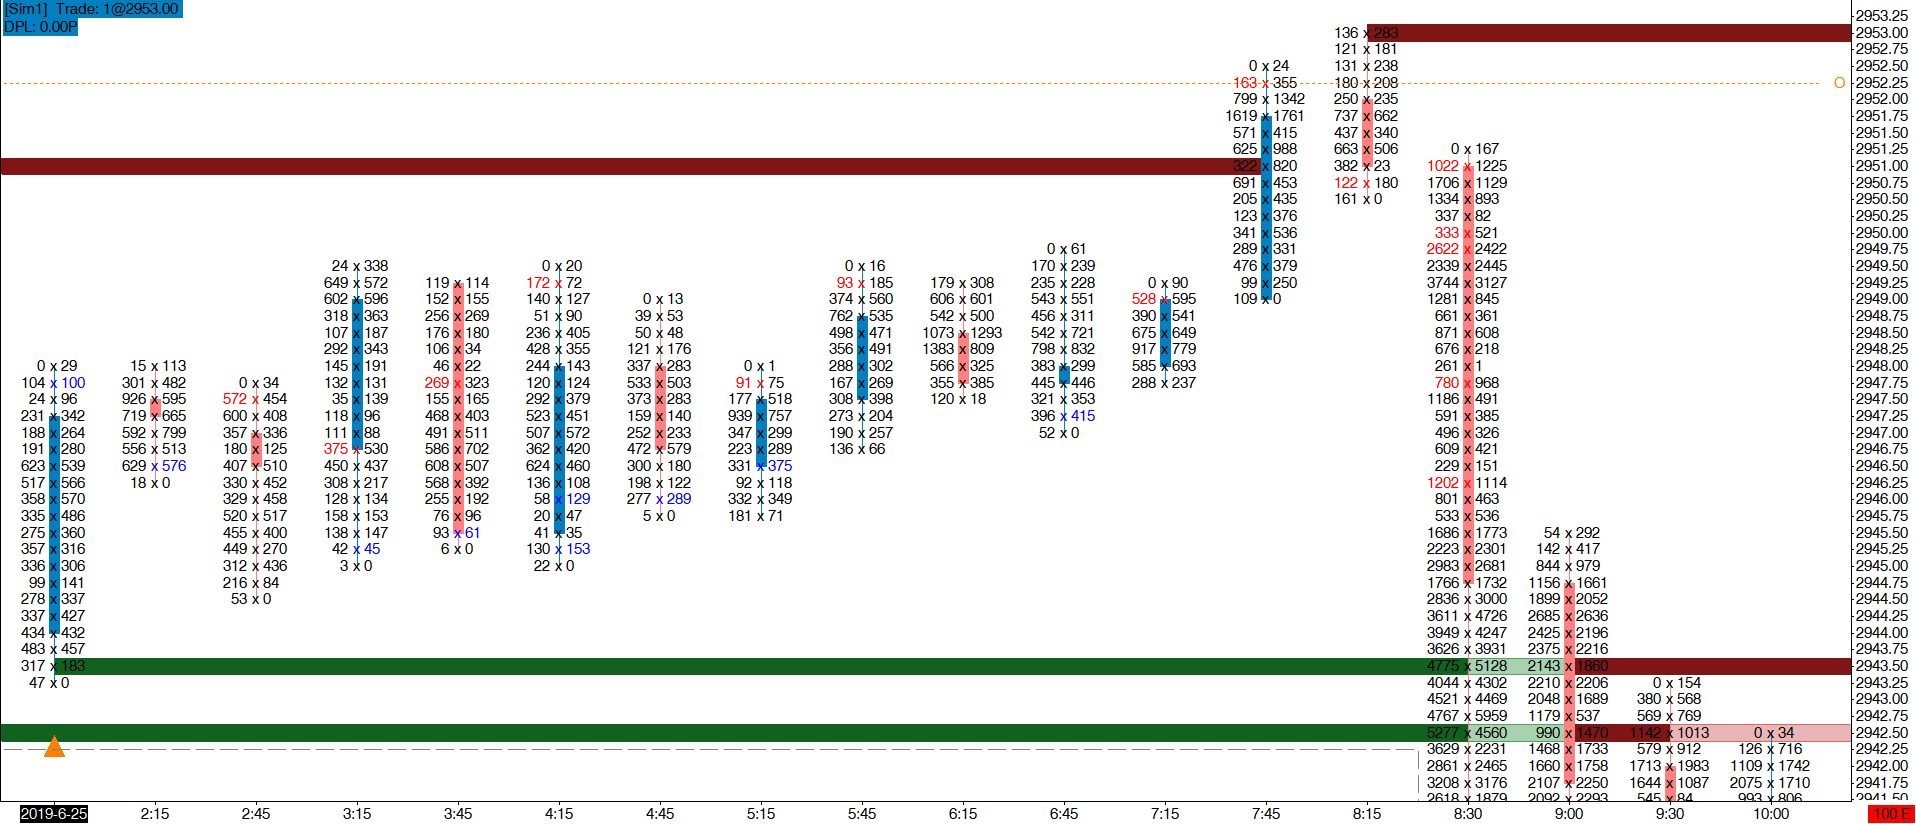
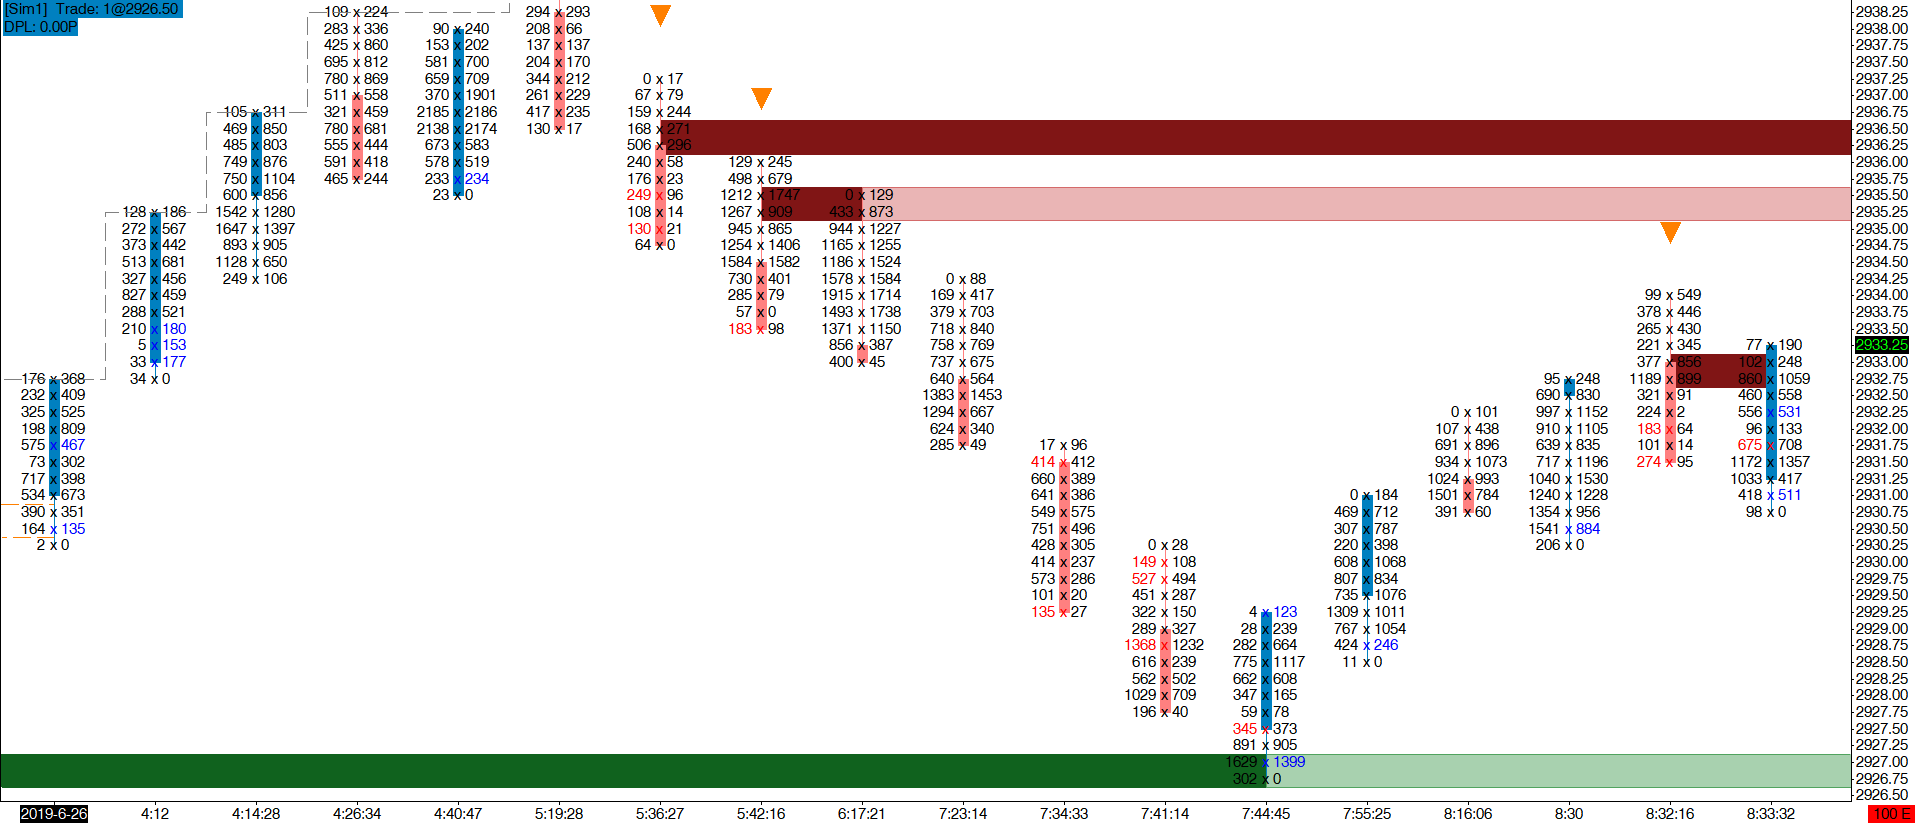
Absorption Pro identifies multiple Absorption patterns. Irrespective of the absorption pattern, it is a sign that the activity of aggressive traders has been overwhelmed by the supply/demand of passive traders’ limit orders. Larger passive trader liquidity has absorbed all of the activity of aggressive traders. The aggressive traders have not been able to defeat the supply/demand of the passive traders. If they had, the market would go higher (aggressive traders consume the available supply) or lower (aggressive traders consume the available demand). If aggressive traders cannot consume the liquidity on offer from passive traders, then the market will not continue in the direction it was travelling. It may pause or reverse, especially if aggressive traders exit their non-performing positions.
Absorption Pro identifies the conditions below. These can be identified individually or in combination. Where supported by your trading platform, you can apply multiple instances of the indicator to your chart to look for the same condition (or combination of conditions) with different filtering parameters.
Please refer to the Pullback Analysis section to learn how Absorption Pro can be used for powerful trigger signals that are independent of your chart type and period.
- Absorption at Price Extremes
This condition can help us identify short term market edges. The indicator is looking for price levels where large volumes of aggressive buying could not take the market higher or large levels of aggressive selling could not take the market lower. This is a sign that the liquidity provided by passive traders is larger than the liquidity taken by aggressive traders.
- Absorption Across Bars*
The chart type and period we are using to look at the market is of no concern to other traders, effectively it is wrong! This method identifies prices where absorption of buying or selling is consistently occurring irrespective of chart type and period. By combining the Advanced Lookback Filter with the indicator’s volume filters, you can ask questions like ‘where are the price levels that have absorbed at least 1000 contracts since the start of this session?‘.
*Absorption Across Bars is available only in Sierra Chart.
- Trapped Aggressive Traders
Every trader has experienced buying the high or selling the low. This method highlights when buyer (or seller) Aggression is identified at the top (or bottom) of a bar and the aggressive traders are trapped at the wrong price.

- Contested Levels
This method identifies price levels in close proximity to each other where large traders are battling and highlights which side has won the the battle due to larger supply or demand.
Indicator Settings & Outputs Reference
Select any or all of the Absorption condition(s) that you wish Absorption Pro to detect and visualize:
• Identify Absorption At Extreme? (Yes/No)
• Identify Absorption Across Bars? (Yes/No)
• Identify Trapped Aggressors At Extreme? (Yes/No)
• Identify Contested Level Outcomes? (Yes/No)
The imbalance settings are used to control how Trapped Aggressors At Extreme are identified. Read this section: Imbalance Settings for a full explanation of each setting:
• Minimum Diagonal Bid/Ask Imbalance %
• Compare Zero Diagonal Bid/Ask Imbalances?
• Miniumum Volume
• Minimum Bid/Ask Delta
The Absorption At Extreme condition can be filtered using the Price Reversal Filter.
You can apply the emoji Advanced Lookback Filter to Absorption At Extreme and Trapped Aggressors At Extreme, i.e. the Absorption conditions that occur at bar extreme, to filter relative highs and lows.
The minimum number of aggressive contracts traded using market orders required for any of the Absorption conditions.
The minimum number of contracts absorbed that is required to trigger any of the Absorption conditions. To understand how this differs from the Minimum Aggressive Volume setting please refer to Absorption & Delta At Price.
If this is set to a non-zero value, the Absorption Across Bars mode will look back across the selected quantity of bars rather than use the Advanced Lookback Filter settings. You can use this input if you are applying Absorption Across Bars in combination with another Absorption condition in a single instance of the indicator and want to use separate lookback settings for each condition.
When evaluating Absorption Across Bars, select how many ticks apart price levels can be to count as an absorbed level. Typically this will be in the range of 0-2 ticks.
When evaluating Contested Levels, select how many ticks apart price levels can be to count as a contested level. Typically this will be in the range of 0-2 ticks.
For Absorption At Extreme and Trapped Aggressors At Extreme, select whether the condition is identified when absorption or aggressive trading is happening:
• at the bar’s extreme price
• at the bar’s extreme price plus the price level 1 tick inside
• within the bar’s candlestick wick
Select whether the indicator is to be used to analyse pullback order flow. Please refer to the Pullback Analysis section for a detailed explanation of this mode.
The number of ticks away from the bar high/low that the Supply/Demand indicator Output Signals are drawn.
The number of ticks away from the bar high/low that the Pullback indicator signals are drawn when using Pullback Analysis .
The standard set of EmojiZone Visualization Settings as described within the EmojiZone Visualisation Modes documentation.
This indicator provides:
• Output Signals
• EmojiZone Data
• Pullback Analysis Output Signals
In addition, the following data is provided:
• Absorbed Buyer Volume
• Absorbed Seller Volume
These outputs represent the number of contracts absorbed.