Consider a 30-minute bar that closed higher than it opened, but below its high. This bar opened, went lower, reversed from the low, went higher, reversed from the high and closed. It closed because 30 minutes had passed.
Inside this bar are six 5-minute bars, or two 15-minute bars, or a quantity of tick-based, volume-based, reversal-based or range-based bars. Which one of these views of the market is right? None of them! They are all arbitrary views of how price has traded over a selected period. The same indicator applied to any smaller timeframe charts will likely give different results because the volume data that is contained in each bar differs as you divide the price movement over different periods.
emoji Pullback Analysis provides a method to overcome the limitations of these arbitrary chart periods. We analyse the volume that has traded since price traded at the high or low of your current bar. We are now looking at the auction inside the auction.
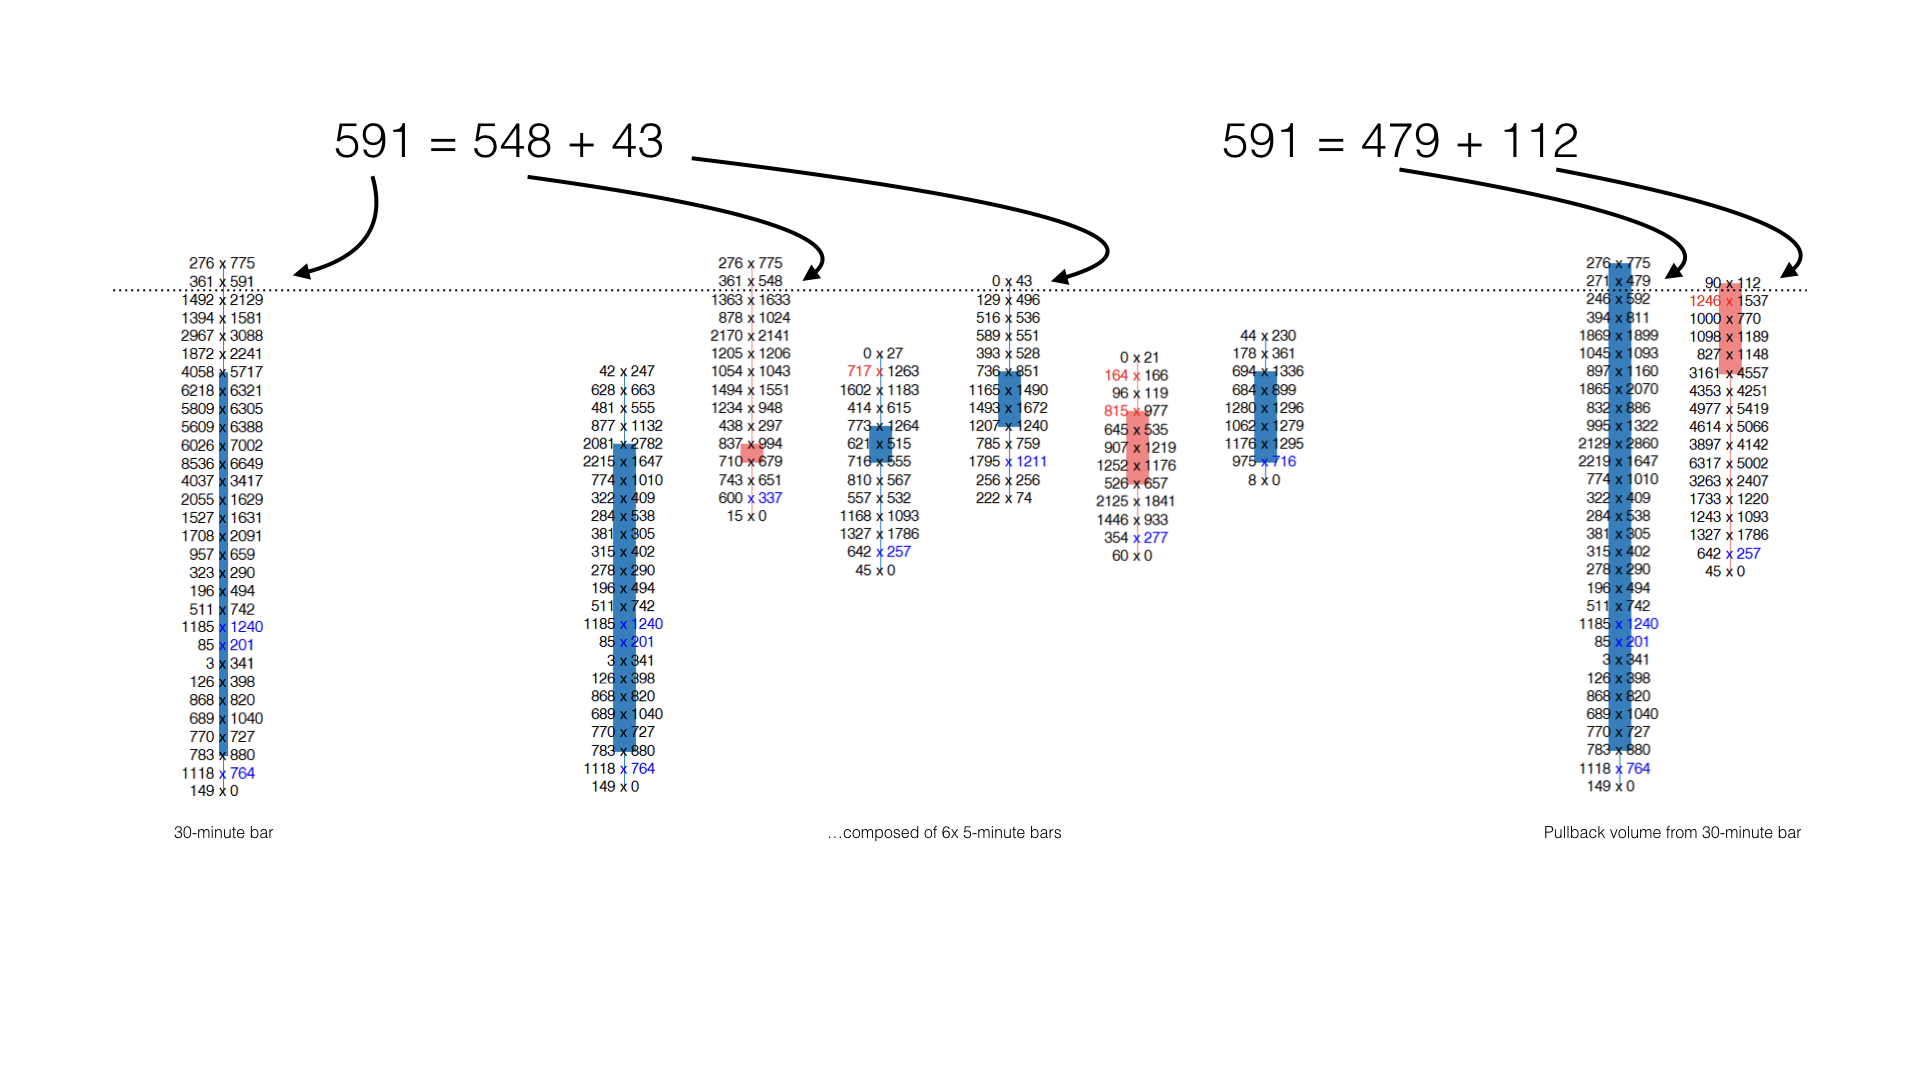
You can use any or all the following indicators to analyse Pullback volume that has occurred since the bar’s extreme price to locate Supply/Demand Events within this Pullback volume:
- Absorption Pro
- EDGE Zones™
- Price Rejector Pro
- Small Prints
This can create opportunities for really well-timed and well-located entries and exits while the current bar is forming.
To enable this analysis, use the: Pullback Evaluation setting. Whatever other settings you have configured for the indicator will apply to the analysis of the Pullback volume analysis unless you are using Absorption Pro.
Pullback Analysis using Absorption Pro
Absorption Pro highlights the price levels where maximum absorption is occurring. The other Absorption Pro modes are not relevant when analysing pullback volume.
Pullback Evaluation modes
- Off
No pullback evaluation is performed by the indicator.
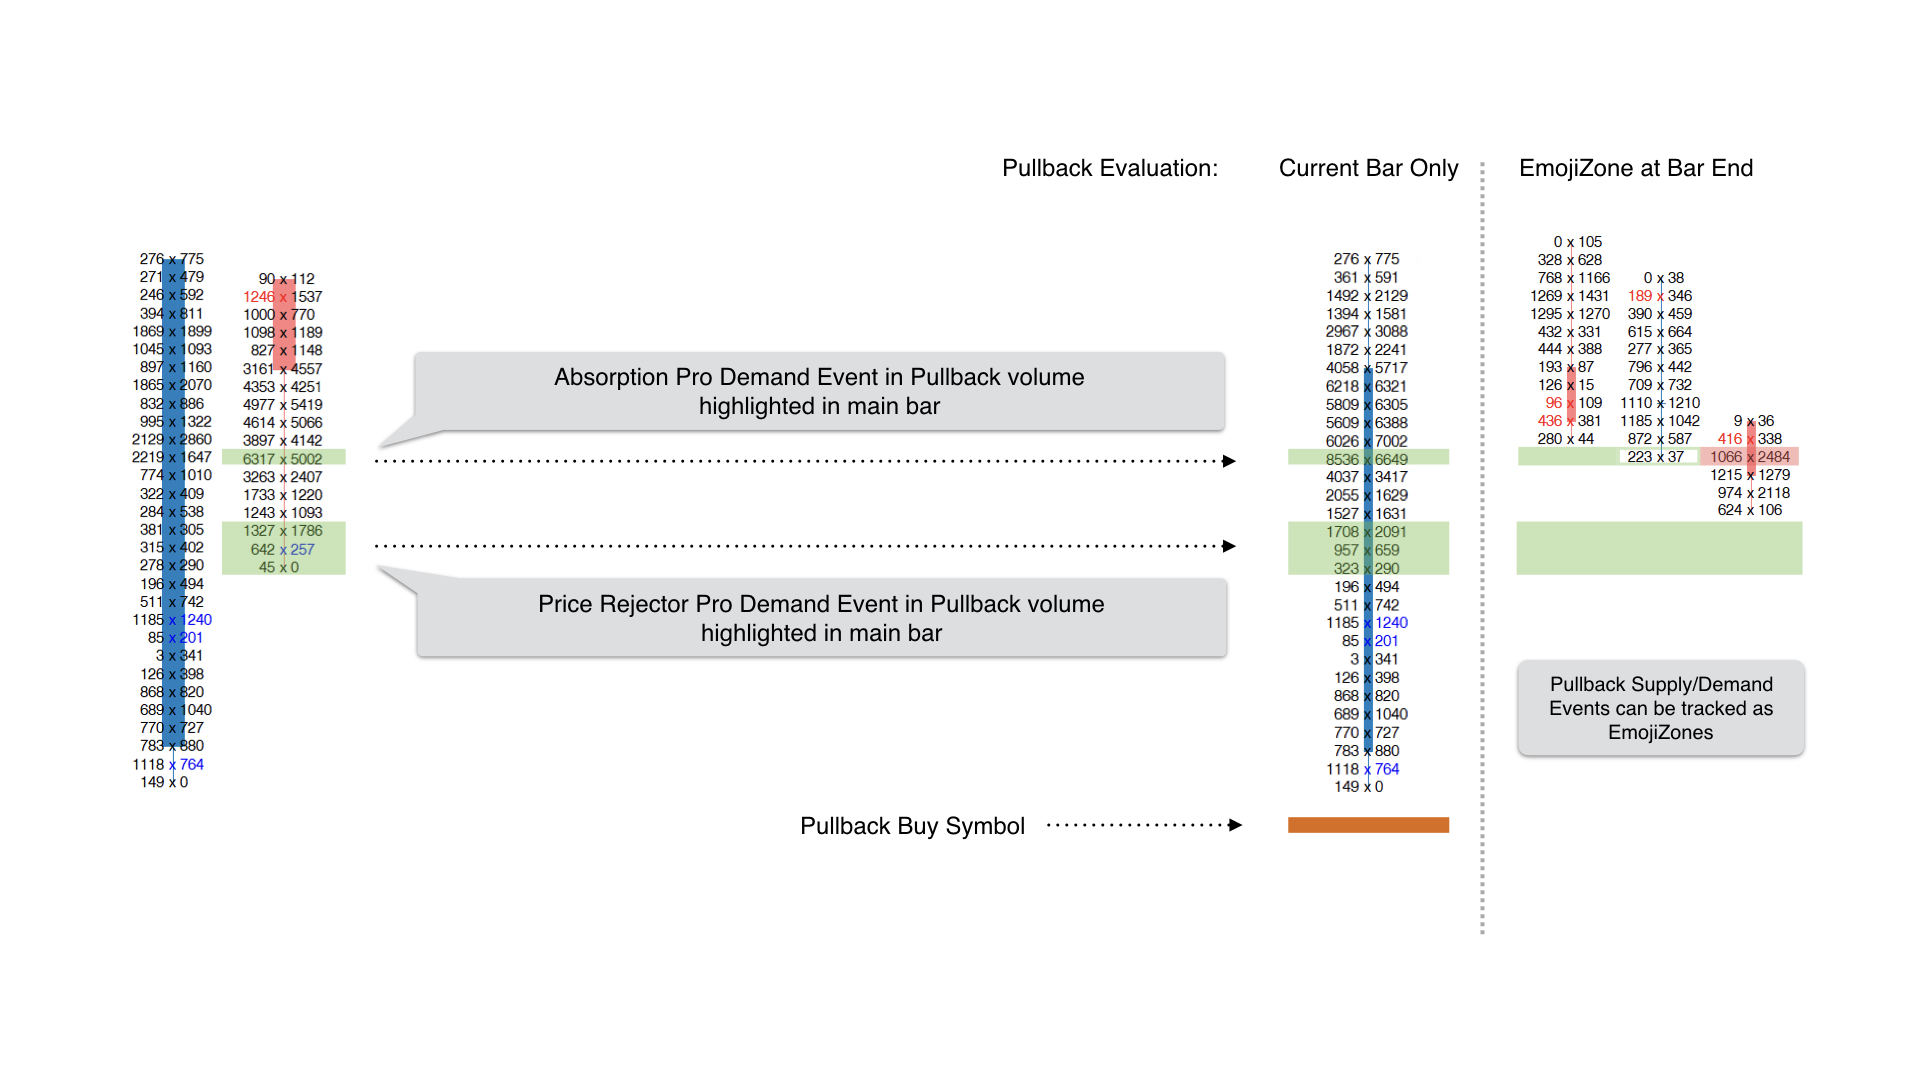
- Current Bar Only
The indicator is applied to the pullback volume since the current bar’s high or low. If a Supply/Demand Event is identified within the pullback volume:
• the indicator’s Pullback Buy (or Pullback Sell) Output will evaluate to +1
• the selected Pullback Buy (or Pullback Sell) Symbol will be drawn below (or above) the current bar, offset by the number of ticks specified in the Pullback Offset (Ticks) setting
• the price range representing Supply or Demand will be highlighted in the current bar using the Pullback Demand (and Supply) High Price/Low Price Output settings. - EmojiZone at Bar End
In addition to the visualizations of Current Bar Only mode, at the close of the bar, the Supply/Demand Event identified within the pullback analysis forms a new EmojiZone that will be tracked as it retrades, just like any other EmojiZone.
In this way, Supply/Demand Events that occur only at bar extremes, e.g. Absorption at Bar Extreme, Price Rejector Pro, Small Print At Extreme, can be highlighted when they are occurring inside a larger bar at the level based upon the pullback volume.
Using Pullback Analysis only…
You may find that you wish to use less conservative indicator settings for pullback analysis than those used on the regular chart bars. Depending upon your trading platform, you can achieve this by applying multiple instances of the indicator to your chart: one set with the settings for the main chart bars and Pullback Evaluation: Off, the other set for your pullback analysis and Pullback Evaluation: Current Bar Only or EmojiZone at Bar End.
Of course, if you are using EmojiZone at Bar End, the indicator will also create and visualize EmojiZones for all the Supply/Demand Events, not only those that occur within the pullback volume. You can set EmojiZone Visualization: Pullback Only to tell the indicator to only create EmojiZones for events occurring within the pullback volume. In this way you can also use an indicator only for Pullback Analysis and not have it analyse the regular chart bars.