The Advanced Lookback Filter is used by many emoji trading indicators. It allows you to filter Supply/Demand Events based upon price levels that are relatively high or low based upon time windows that you can define. You can build sophisticated rules that are independent of the type and period of the chart to which the indicator is applied, for example:
…only allow indicator Supply/Demand Events that are within two ticks of the highest high or lowest low of a rolling 30-minute time period from the start of the current session.
Events are filtered based upon whether the current bar’s price is equal to or higher (or lower) than then highest high (or lowest low) over the specified lookback period.
You can also specify a price threshold offset using the HH/LL Price Threshold (ticks) setting. This loosens the filter to allow conditions where the current bar’s price is within x ticks of the highest high (or lowest low) over the specified lookback period where x is the number entered in the HH/LL Price Threshold (ticks) setting.
The following settings are used by the Advanced Lookback Filter and examples of each filtering mode are provided below.
Select from the following filtering modes:
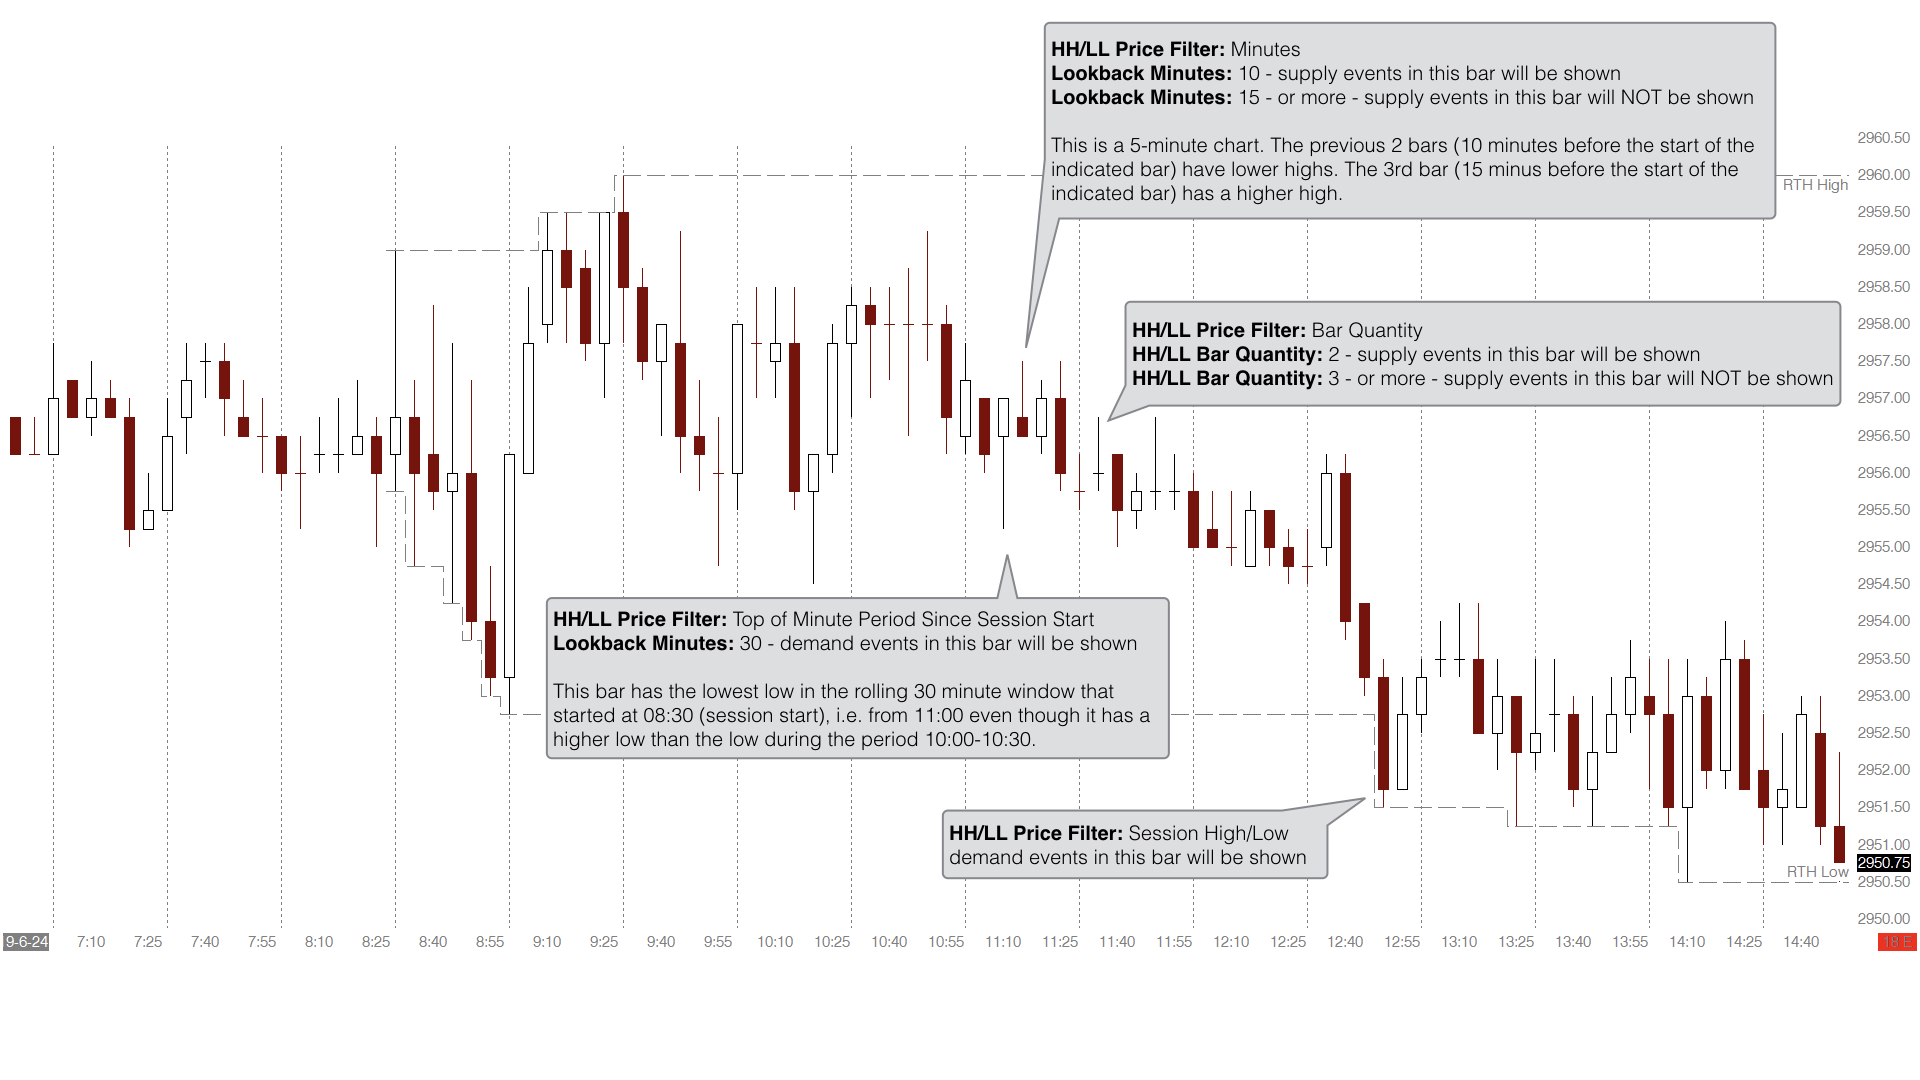
– Bar Quantity
– Session High/Low
– Daily High/Low
– Minutes
– Top of Minute Period Since Session Start
Enter the number of bars to look back across. The current bar is counted as bar 1, i.e. entering a value of 2 will consider the current and the previous bar.
The number of minutes to be used by the Minutes and Top of Minute Period Since Session Start modes.
The quantity of ticks inside the period high or low that the filter will allow. For example, a value of 2 sets the filter to pass a Supply/Demand Event that occurs within 2 ticks of the highest high (or lowest low) during the filter lookback period.
Below are example 5-minute chart of ES starting at the overnight open. The times shown are US Central Time, the high and low for the overnight (ETH Extended Trading Hours) and daily session (RTH Regular Trading Hours) are plotted and the vertical lines represent 30-minute time intervals from the start of the overnight and daily sessions. The different Price Filter Period modes are explained on the charts.