In a normal market we would expect:
- lower demand at higher prices – buyers are less willing to buy as prices become more expensive
- lower supply at lower prices – sellers are less willing to sell as prices become cheaper
So we can gauge if prices are too high as we will see less buying volume and if prices are too low we will see less selling volume:
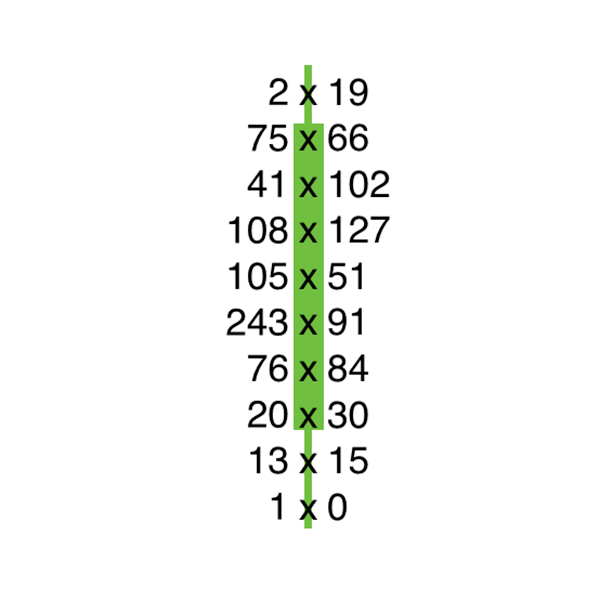
At the top four price levels of this bar we can see a sequential decline in the volume of contracts bought using market orders:
127 > 102 > 66 > 19
The demand was showing signs of exhaustion. At higher prices, there was less desire to buy and this is evidenced within the Footprint chart data.
Likewise, at the bottom of the bar, we can see selling exhaustion through the lowest five price levels:
243 > 76 > 20 > 13 > 1
We can use the presence of exhaustion to identify when price is too high or too low. While this may not indicate that the market will reverse, it can be a good early warning that a long move in the previous direction of travel may come to an end.
Likewise, the lack of exhaustion can be a good indication that prices are not too high or too low and likely to continue in their current direction. The bar above opened, traded down two ticks then closed much higher. We can see that the volume of market orders lifting the offer increased through the lowest five price levels – there was more buying at higher prices! Price therefore cannot have been too high at these levels.