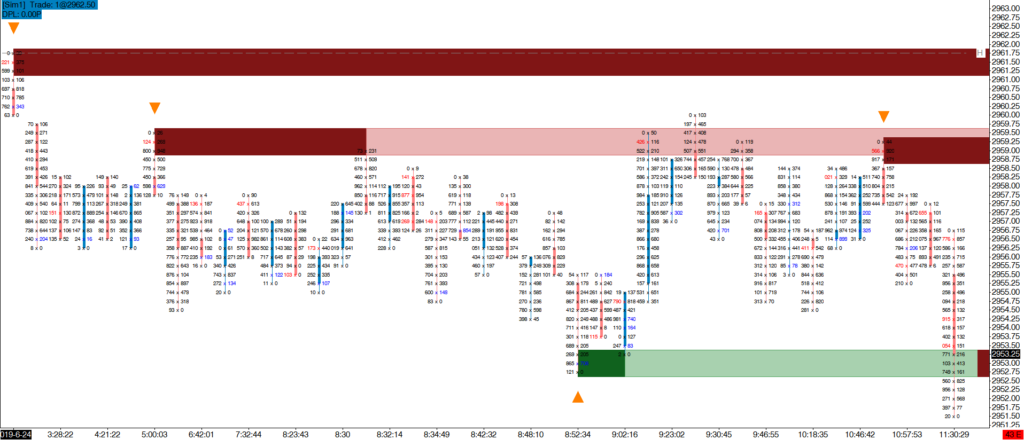
Price Rejector Pro allows you to combine Aggression, Absorption and Exhaustion to highlight low risk reversal points. This is a simple but powerful combination of order flow conditions. In plain language you can see when and where…
…we run out of buyers (sellers) and can see that sellers (buyers) are more powerful and that aggressive sellers are entering the market.
Selective use of Price Rejector Pro with the Advanced Lookback Filter and Pullback Analysis can form the foundation of a successful trading strategy as you are taking a significant quantity of order flow events into account.
Price Rejector Pro will identify:
- Exhaustion at the extreme of the bar
- Aggression in the opposite direction
- Absorption through the area of Exhaustion
You can tighten or loosen the settings for Aggression and Absorption to fine tune the indicator’s signals. You may, for example, only wish to highlight Exhaustion to see when a directional move is losing power but not facing the potential of a strong reversal.
Indicator Settings & Outputs Reference
Select whether Price Rejector Pro is to analyse the volume in the main chart bars or in a specified Volume Profile study.
Selected Volume Profile Study
Select the Volume Profile Study on the chart to which Volume Profile Analysis should apply.
Learn more about emoji Volume Profile Analysis.
The imbalance settings are used to control how Aggression that opposes the Price Rejector Exhaustion is identified. Read this section: Imbalance Settings for a full explanation of each setting:
• Minimum Diagonal Bid/Ask Imbalance %
• Compare Zero Diagonal Bid/Ask Imbalances?
• Minimum Volume
• Minimum Bid/Ask Delta
Select whether a Price Rejector Supply/Demand Event requires:
• Exhaustion Only
• Aggregate Absorption: the total demand (or supply) through an area of buying (or selling) exhaustion was absorbed
• Consistent Absorption: every price level through the area of exhaustion was absorbed
In Aggregate Absorption mode it is not necessary that every price level through the area of exhaustion is absorbed and is therefore a looser filter than Consistent Absorption.
Select whether the Price Rejector condition is filtered using the Price Reversal Filter. If not, it is possible to have Price Rejector Supply/Demand Events at both ends of a bar, especially when using longer time frame chart periods.
Filter Price Rejector Supply/Demand Events using the emoji Advanced Lookback Filter to only identify events that occur at relative highs and lows.
Maximum Extreme Print Ratio %
These inputs allow fine tuning of the Exhaustion condition.
Maximum Extreme Print Volume sets the highest ask volume at the bar’s highest price or highest bid volume at the bar’s lowest price that will be considered for a Price Rejector Supply/Demand Event. If volume exceeds this setting, then no condition is recognised. This is similar in concept to the Small Prints indicator’s Small Print At Extreme detection.
Maximum Extreme Print Ratio % sets the ratio of the ask volumes at the bar’s highest two prices or bid volumes at the bar’s lowest two prices. This ratio must be higher than the value entered to recognise the Exhaustion element of a Price Rejector Supply/Demand Event. This is similar in concept to the Bar Ratio calculation within the Order Flow Snapshot indicator.
Select whether the imbalance used to identify Aggression in the opposite direction to Exhaustion is located:
• Extreme: at the first possible price level for an opposing imbalance
• Extreme + 1: as above or one price level ahead of this
• Within Zone: at any price level within the area of Exhaustion
Select whether the indicator is to be used to analyse pullback order flow. Please refer to the Pullback Analysissection for a detailed explanation of this mode.
The number of ticks away from the bar high/low that the Supply/Demand indicator Output Signals are drawn.
The number of ticks away from the bar high/low that the Pullback indicator signals are drawn when using Pullback Analysis .
The standard set of EmojiZone Visualization Settings as described within the EmojiZone Visualisation Modes documentation.
This indicator provides:
• Output Signals
• EmojiZone Data
• Pullback Analysis Output Signals
In addition, the following data is provided:
• Absorbed Buyer Volume
• Absorbed Seller Volume
These outputs represent the number of contracts absorbed within the Price Rejector EmojiZone.