EmojiZone Visualization: track supply & demand over time…
When an emoji indicator identifies a pattern within the order flow traded volume representing a notable supply/demand event it stores the associated price levels and the emergence of New Supply or New Demand within your computer’s memory.
These New Supply and New Demand events are tracked and analysed as the market revisits these levels using price and order flow traded volume to determine whether the identified levels are likely to hold or break.
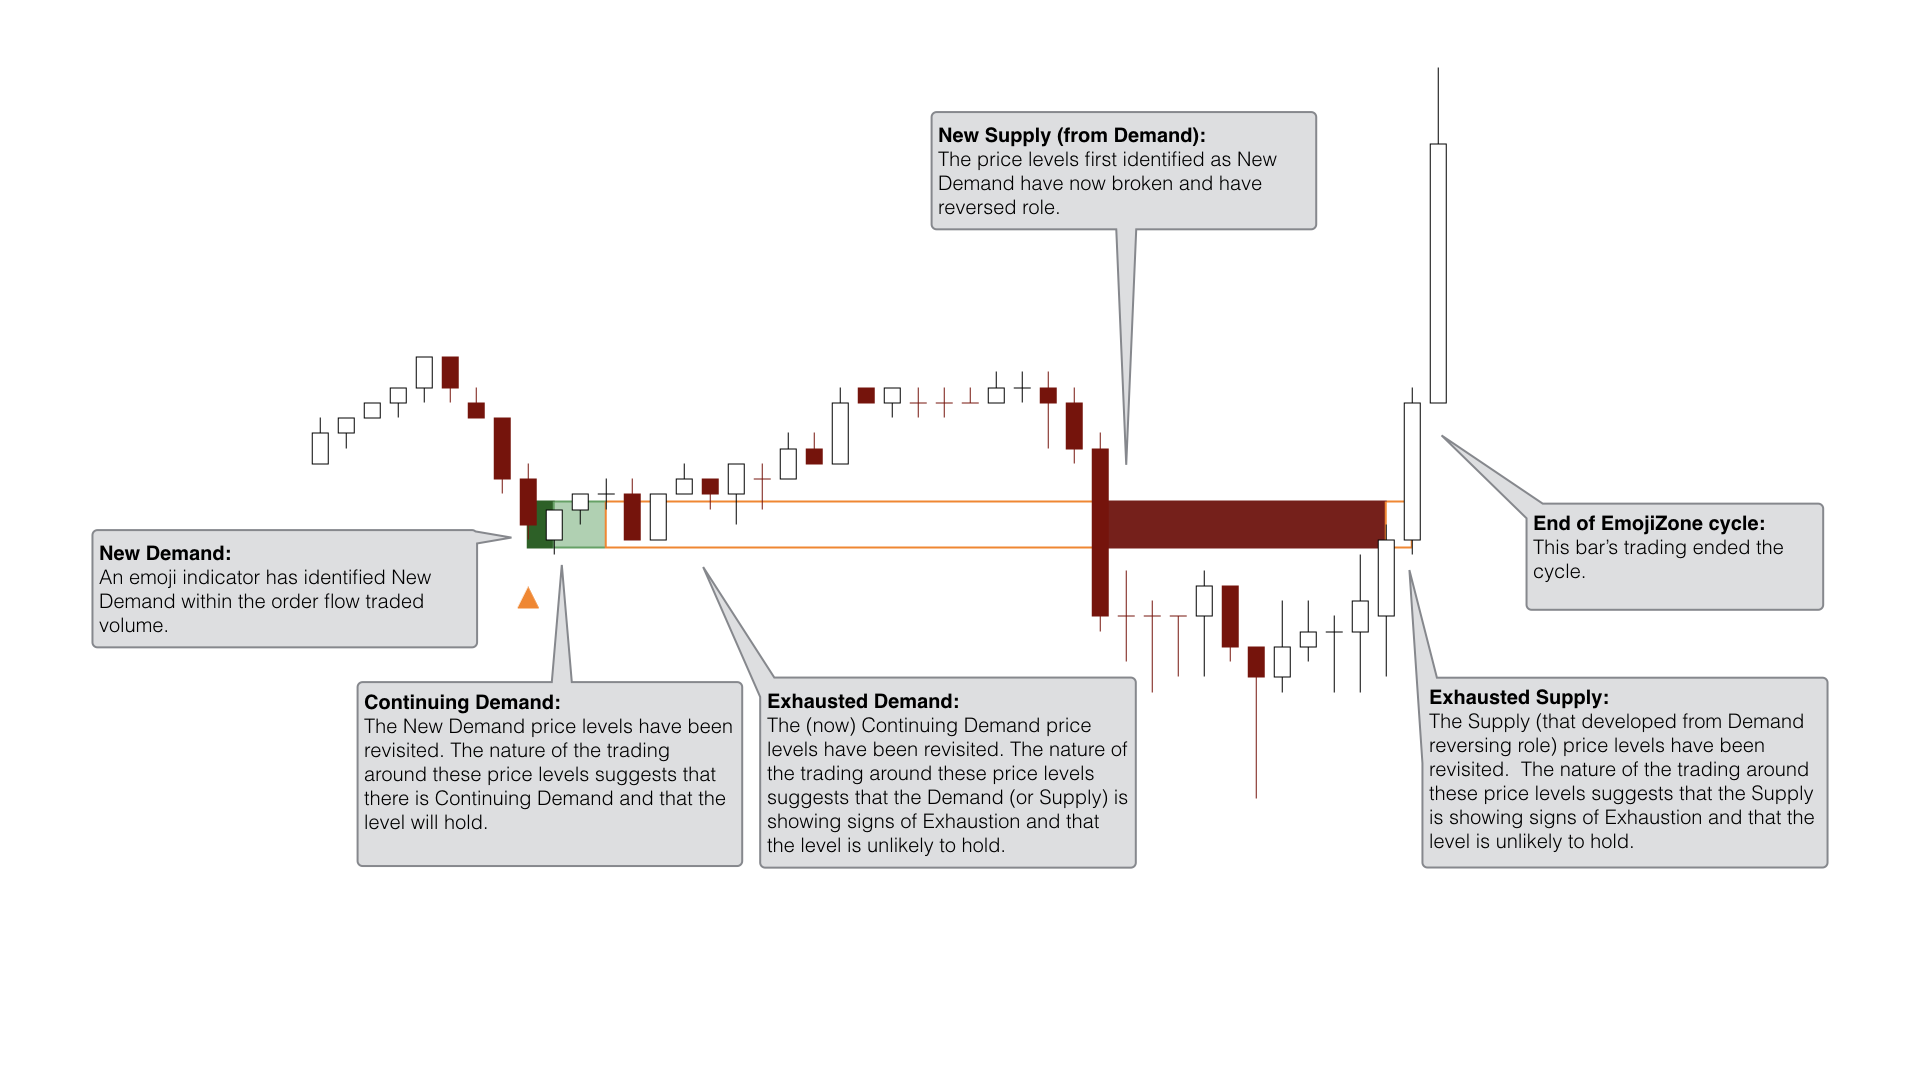
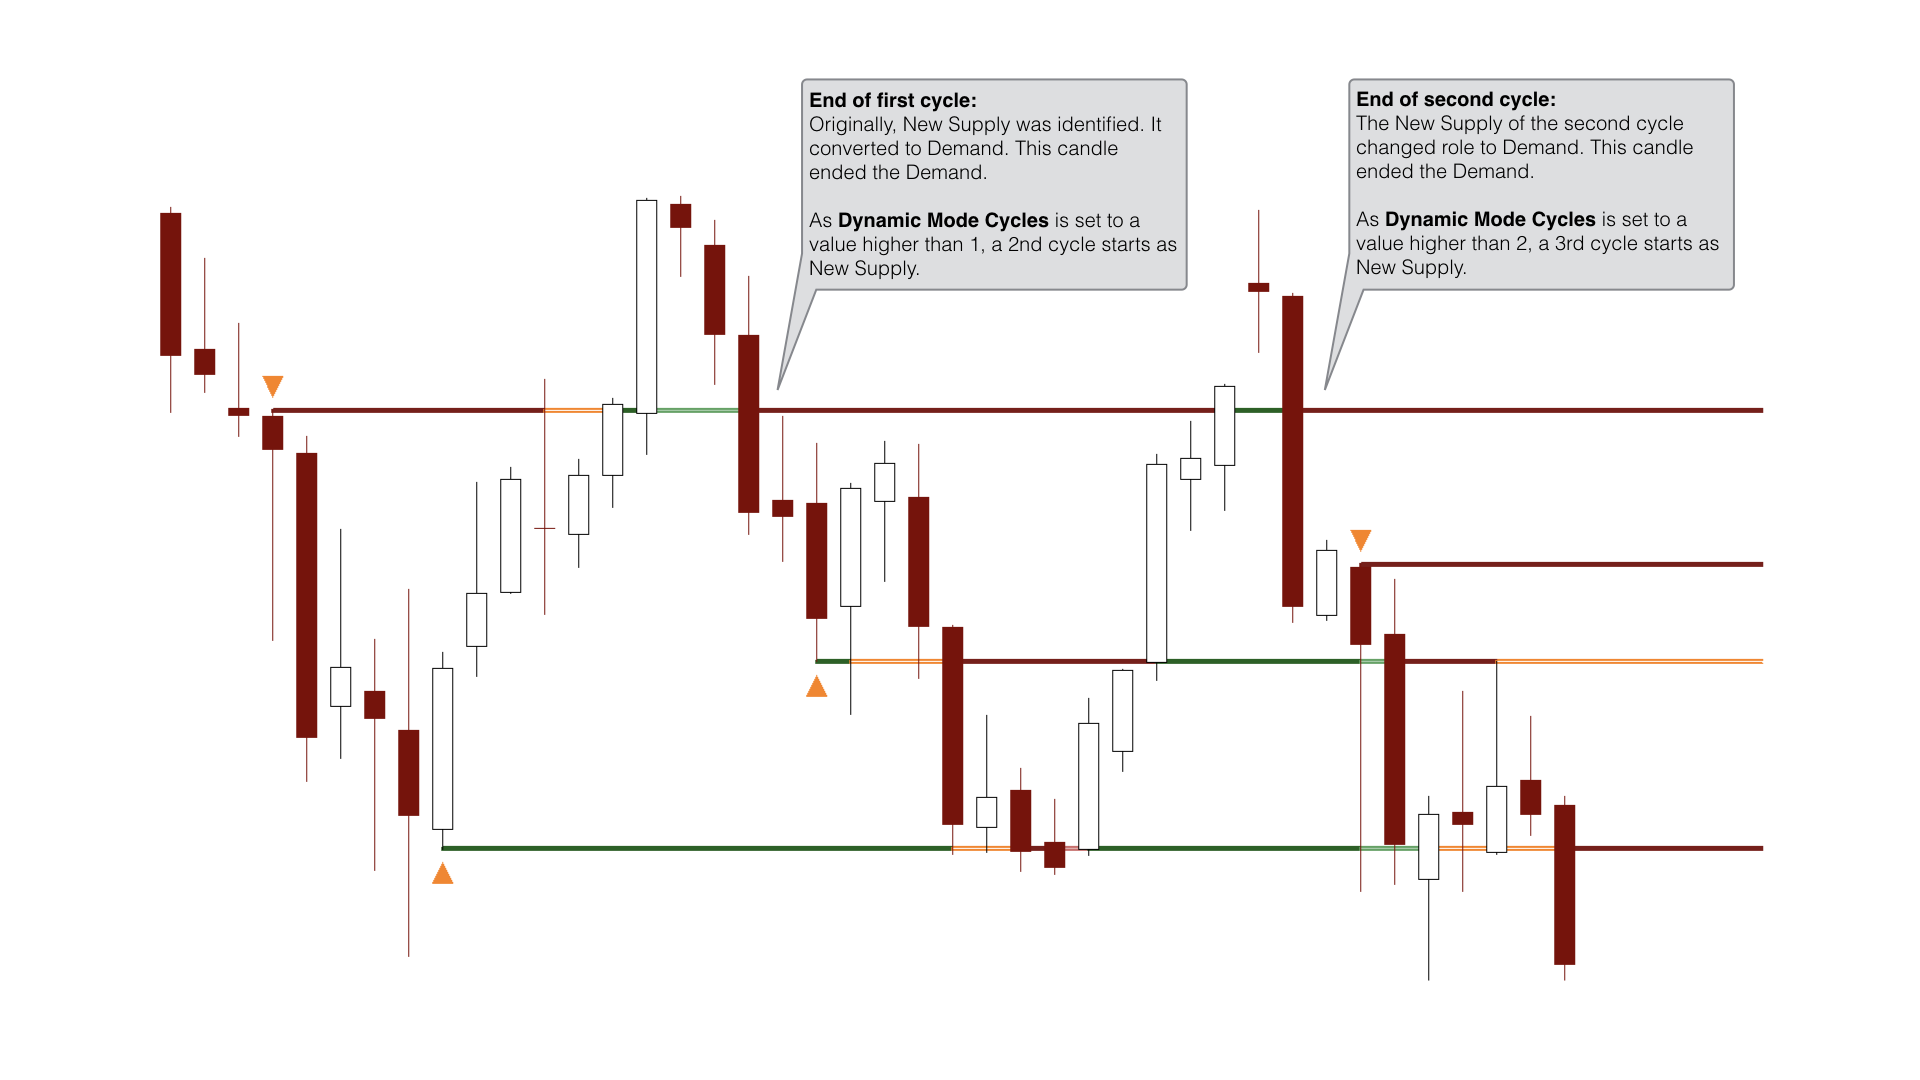
At the end of this EmojiZone cycle, the level is no longer tracked… unless you want it to be!
You can define how many times a cycle will move back to its first state and continue being tracked.
This can be especially useful on longer term chart analysis to identify intra-day levels that have potential to stop a move, for example by using the Small Prints indicator to highlight Zero Prints within the body of a daily bar.